Note
Click here to download the full example code
General Stereographic
This map projection is a conformal, azimuthal projection. It is mainly used with a projection center in one of the poles. Then meridians appear as straight lines and cross latitudes at a right angle. Unlike the azimuthal equidistant projection, the distances in this projection are not displayed in correct proportions. It is often used as a hemisphere map like the Lambert Azimuthal Equal Area projection.
slon0/lat0[/horizon]/scale or Slon0/lat0[/horizon]/width
lon0/lat0 specifies the projection center, the optional horizon parameter
specifies the max distance from projection center (in degrees, < 180, default 90).
This projection can be displayed:
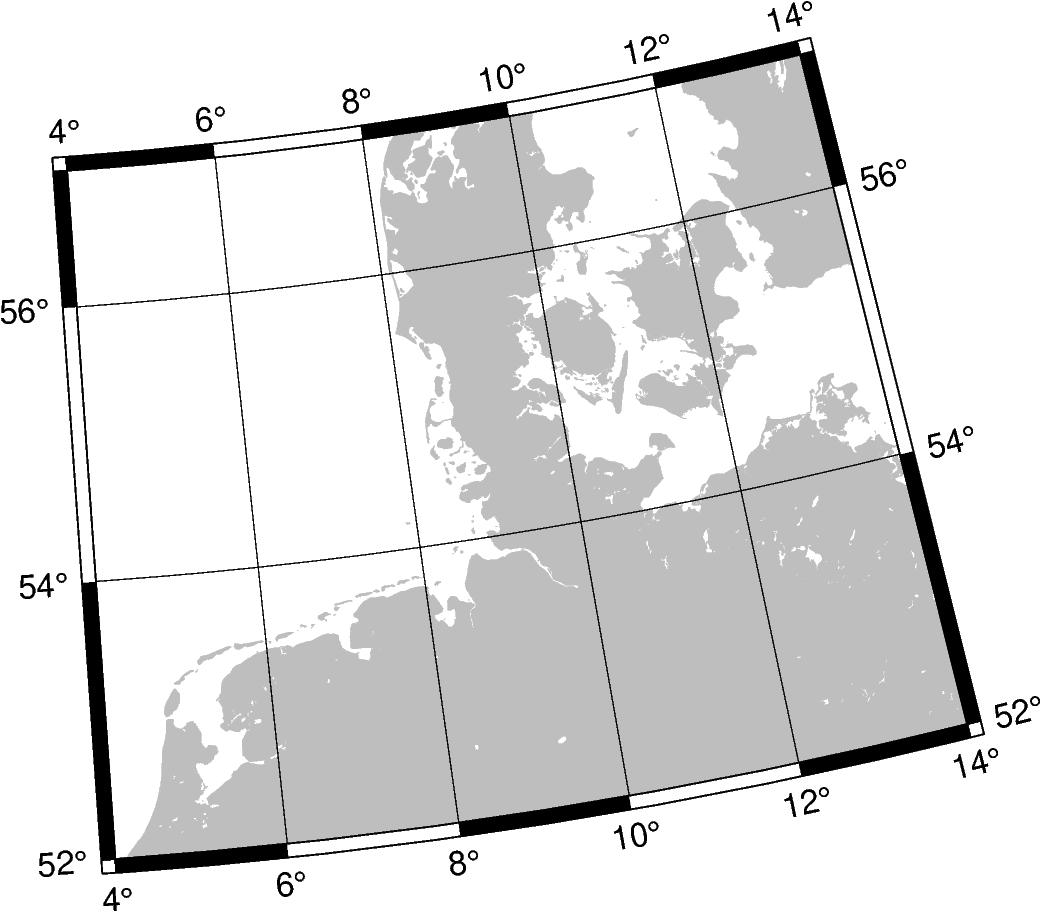
With map boundaries coinciding with longitude and latitude:
regionspecified viaxmin/xmax/ymin/ymaxAs a map with rectangular boundaries:
regionspecified as lower left and upper right cornerxlleft/ylleft/xuright/yurightr. Note the appendedr.
Out:
<IPython.core.display.Image object>
import pygmt

fig = pygmt.Figure()
fig.coast(region="4/14/52/57", projection="S0/90/4.5i", frame="ag", land="gray")
fig.show()
Total running time of the script: ( 0 minutes 0.635 seconds)