Note
Go to the end to download the full example code
Bit and hachure patterns
PyGMT allows using bit or hachure patterns via the fill parameter
or similar parameters:
pygmt.Figure.coast: Land and water masses vialandandwater, respectivelypygmt.Figure.histogram: Histogram bars viafillpygmt.Figure.meca: Focal mechanisms viacompressionfillandextensionfillpygmt.Figure.plot: Symbols and polygons viafillpygmt.Figure.rose: Histogram sectors viafillpygmt.Figure.solar: Day-light terminators viafillpygmt.Figure.ternary: Symbols viafillpygmt.Figure.velo: Uncertainty wedges and velocity error ellipses viauncertaintyfillpygmt.Figure.wiggle: Anomalies viafillpositiveandfillnegative
The required argument has the following form:
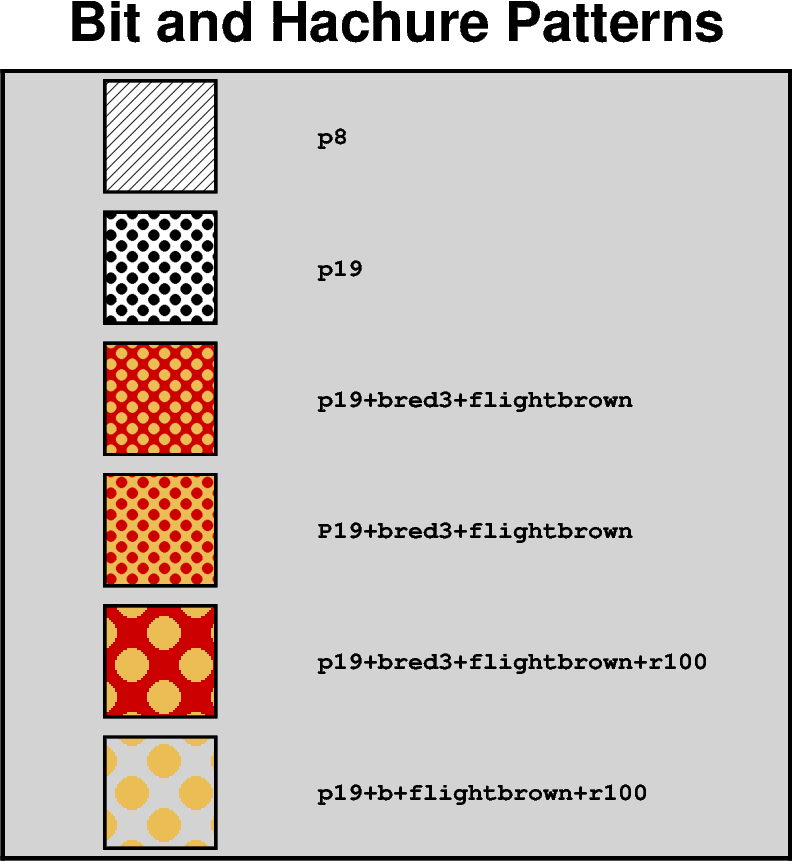
P|ppattern[+bcolor][+fcolor][+rdpi]
pattern can either be a number in the range 1-90 or the name of a 1-, 8-, or 24-bit image raster file. The former will result in one of the 90 predefined 64 x 64 bit-patterns provided by GMT; an overview can by found at https://docs.generic-mapping-tools.org/6.5/reference/predefined-patterns.html. The latter allows the user to create customized, repeating images using image raster files. By specifying upper case P instead of p the image will be bit-reversed, i.e., white and black areas will be interchanged (only applies to 1-bit images or predefined bit-image patterns). For these patterns and other 1-bit images one may specify alternative background and foreground colors (by appending +bcolor and/or +fcolor) that will replace the default white and black pixels, respectively. Excluding color from a fore- or background specification yields a transparent image where only the back- or foreground pixels will be painted. The +rdpi modifier sets the resolution in dpi.
import pygmt

y = 11

fig = pygmt.Figure()
fig.basemap(
    region=[0, 10, 0, 12],
    projection="X10c",
    frame="rlbt+glightgray+tBit and Hachure Patterns",
)

# To use a pattern as fill append "p" and the number of the desired
# pattern. By default, the pattern is plotted in black and white
# with a resolution of 300 dpi
for pattern in [
    # Plot a hachted pattern via pattern number 8
    "p8",
    # Plot a dotted pattern via pattern number 19
    "p19",
    # Set the background color ("+b") to "red3"
    # and the foreground color ("+f") to "lightgray"
    "p19+bred3+flightbrown",
    # Invert the pattern by using a capitalized "P"
    "P19+bred3+flightbrown",
    # Change the resolution ("+r") to 100 dpi
    "p19+bred3+flightbrown+r100",
    # Make the background transparent by not giving a color after "+b";
    # works analogous for the foreground
    "p19+b+flightbrown+r100",
]:
    # Plot a square with the pattern as fill
    fig.plot(
        x=2,
        y=y,
        style="s2c",  # square with a width of 2 centimeters
        pen="1p,black",  # 1 point thick, black outline
        fill=pattern,
    )
    # Add a description of the pattern
    fig.text(
        x=4,
        y=y,
        text=pattern,
        font="Courier-Bold",
        justify="ML",  # justification of the text is Middle Left
    )
    y -= 2

fig.show()
Total running time of the script: (0 minutes 0.193 seconds)