Note
Go to the end to download the full example code.
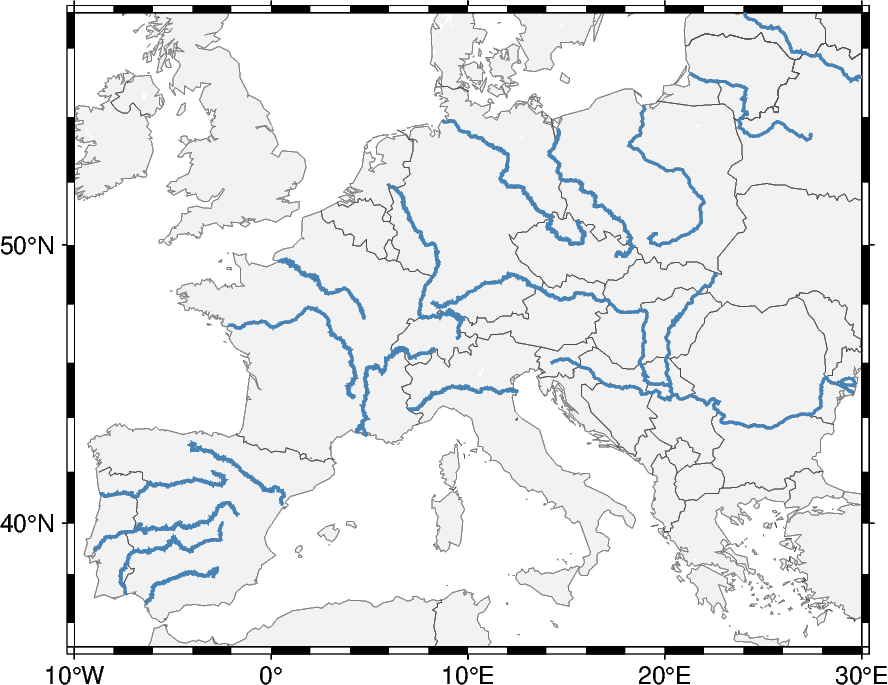
GeoPandas: Plotting lines with LineString or MultiLineString geometry
The pygmt.Figure.plot method allows us to plot geographical data such as lines
with LineString or MultiLineString geometry types stored in a
geopandas.GeoDataFrame object or any object that implements the
__geo_interface__ property.
Use geopandas.read_file to load data from any supported OGR format such as a
shapefile (.shp), GeoJSON (.geojson), geopackage (.gpkg), etc. Then, pass the
geopandas.GeoDataFrame object as an argument to the data parameter of
pygmt.Figure.plot, and style the lines using the pen parameter.
import geodatasets
import geopandas as gpd
import pygmt

# Read a sample dataset provided by the geodatasets package.
# The dataset contains large rivers in Europe, stored as LineString/MultiLineString
# geometry types.
gdf = gpd.read_file(geodatasets.get_path("eea large_rivers"))

# Convert object to EPSG 4326 coordinate system
gdf = gdf.to_crs("EPSG:4326")
print(gdf.head())
           NAME  ...                                           geometry
0        Danube  ...  MULTILINESTRING ((8.1846 48.0807, 8.19049 48.0...
1         Douro  ...  MULTILINESTRING ((-8.67141 41.14934, -8.64362 ...
2          Ebro  ...  MULTILINESTRING ((-4.05971 42.97715, -4.06841 ...
3          Elbe  ...  MULTILINESTRING ((8.69715 53.90109, 8.72716 53...
4  Guadalquivir  ...  MULTILINESTRING ((-6.37899 36.80363, -6.34806 ...

[5 rows x 3 columns]
Total running time of the script: (0 minutes 2.878 seconds)