Note
Go to the end to download the full example code.
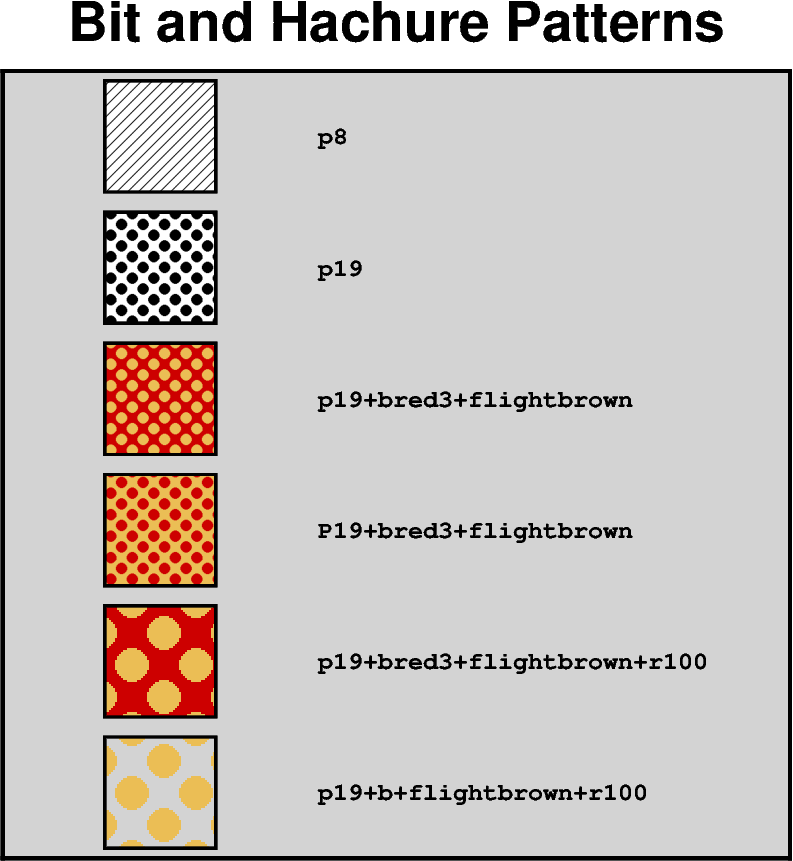
Bit and hachure patterns
In addition to colors, PyGMT also allows using bit and hachure patterns to fill
symbols, polygons, and other areas, via the fill parameter or similar parameters.
Example method parameters that support bit and hachure patterns include:
pygmt.Figure.coast: Land and water masses vialandandwaterpygmt.Figure.histogram: Histogram bars viafillpygmt.Figure.meca: Focal mechanisms viacompressionfillandextensionfillpygmt.Figure.plot: Symbols and polygons viafillpygmt.Figure.rose: Histogram sectors viafillpygmt.Figure.solar: Day-light terminators viafillpygmt.Figure.ternary: Symbols viafillpygmt.Figure.velo: Uncertainty wedges and velocity error ellipses viauncertaintyfillpygmt.Figure.wiggle: Anomalies viafillpositiveandfillnegative
GMT provides 90 predefined patterns that can be used in PyGMT. The patterns are numbered from 1 to 90, and can be colored and inverted. The resolution of the pattern can be changed, and the background and foreground colors can be set. For a complete list of available patterns and the full syntax to specify a pattern, refer to the Bit and hachure patterns.
import pygmt

# A list of patterns that will be demonstrated.
# To use a pattern as fill append "p" and the number of the desired pattern.
# By default, the pattern is plotted in black and white with a resolution of 300 dpi.
patterns = [
    # Plot a hachted pattern via pattern number 8
    "p8",
    # Plot a dotted pattern via pattern number 19
    "p19",
    # Set the background color ("+b") to "red3" and the foreground color ("+f") to
    # "lightgray"
    "p19+bred3+flightbrown",
    # Invert the pattern by using a capitalized "P"
    "P19+bred3+flightbrown",
    # Change the resolution ("+r") to 100 dpi
    "p19+bred3+flightbrown+r100",
    # Make the background transparent by not giving a color after "+b";
    # works analogous for the foreground
    "p19+b+flightbrown+r100",
]

fig = pygmt.Figure()
fig.basemap(
    region=[0, 10, 0, 12],
    projection="X10c",
    frame="rlbt+glightgray+tBit and Hachure Patterns",
)

y = 11
for pattern in patterns:
    # Plot a square with the pattern as fill.
    # The square has a size of 2 centimeters with a 1 point thick, black outline.
    fig.plot(x=2, y=y, style="s2c", pen="1p,black", fill=pattern)
    # Add a description of the pattern.
    fig.text(x=4, y=y, text=pattern, font="Courier-Bold", justify="ML")
    y -= 2
fig.show()
Total running time of the script: (0 minutes 0.185 seconds)