Note
Click here to download the full example code
Multi-parameter symbols
The pygmt.Figure.plot method can plot individual multi-parameter
symbols by passing the corresponding shortcuts (e, j, r, R,
w) to the style parameter:
e: ellipse
j: rotated rectangle
r: rectangle
R: rounded rectangle
w: pie wedge
import pygmt
We can plot multi-parameter symbols using the same symbol style. We need to
define locations (lon, lat) via the x and y parameters (scalar for
a single symbol or 1d list for several ones) and two or three symbol
parameters after those shortcuts via the style parameter.
The multi-parameter symbols in the style parameter are defined as:
e: ellipse,
direction/major_axis/minor_axisj: rotated rectangle,
direction/width/heightr: rectangle,
width/heightR: rounded rectangle,
width/height/radiusw: pie wedge,
radius/startdir/stopdir, the last two arguments are directions given in degrees counter-clockwise from horizontal
Upper-case versions E, J, and W are similar to e, j and w but expect geographic azimuths and distances.
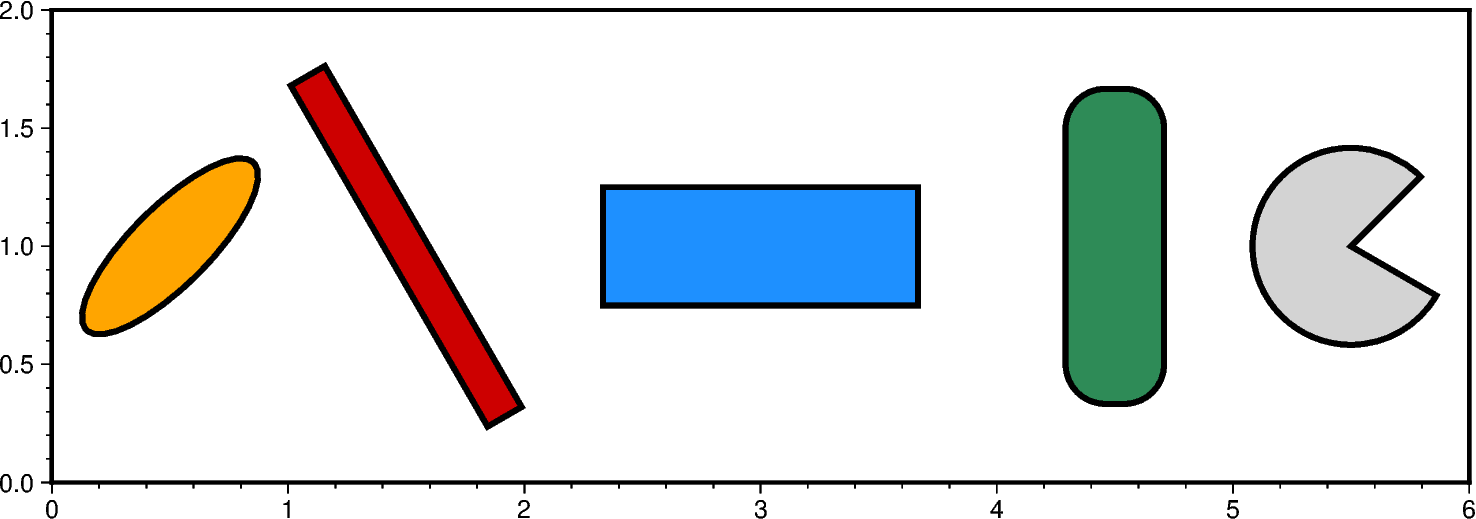
fig = pygmt.Figure()
fig.basemap(region=[0, 6, 0, 2], projection="x3c", frame=True)

# Ellipse
fig.plot(x=0.5, y=1, style="e45/3/1", color="orange", pen="2p,black")
# Rotated rectangle
fig.plot(x=1.5, y=1, style="j120/5/0.5", color="red3", pen="2p,black")
# Rectangle
fig.plot(x=3, y=1, style="r4/1.5", color="dodgerblue", pen="2p,black")
# Rounded rectangle
fig.plot(x=4.5, y=1, style="R1.25/4/0.5", color="seagreen", pen="2p,black")
# Pie wedge
fig.plot(x=5.5, y=1, style="w2.5/45/330", color="lightgray", pen="2p,black")

fig.show()
Out:
<IPython.core.display.Image object>
We can also plot symbols with varying parameters via defining those values in
a 2d list or numpy array ([[parameters]] for a single symbol or
[[parameters_1],[parameters_2],[parameters_i]] for several ones) or using
an appropriately formatted input file and passing it to data.
The symbol parameters in the 2d list or numpy array are defined as:
e: ellipse,
[[lon, lat, direction, major_axis, minor_axis]]j: rotated rectangle,
[[lon, lat, direction, width, height]]r: rectangle,
[[lon, lat, width, height]]R: rounded rectangle,
[[lon, lat, width, height, radius]]w: pie wedge,
[[lon, lat, radius, startdir, stopdir]], the last two arguments are directions given in degrees counter-clockwise from horizontal
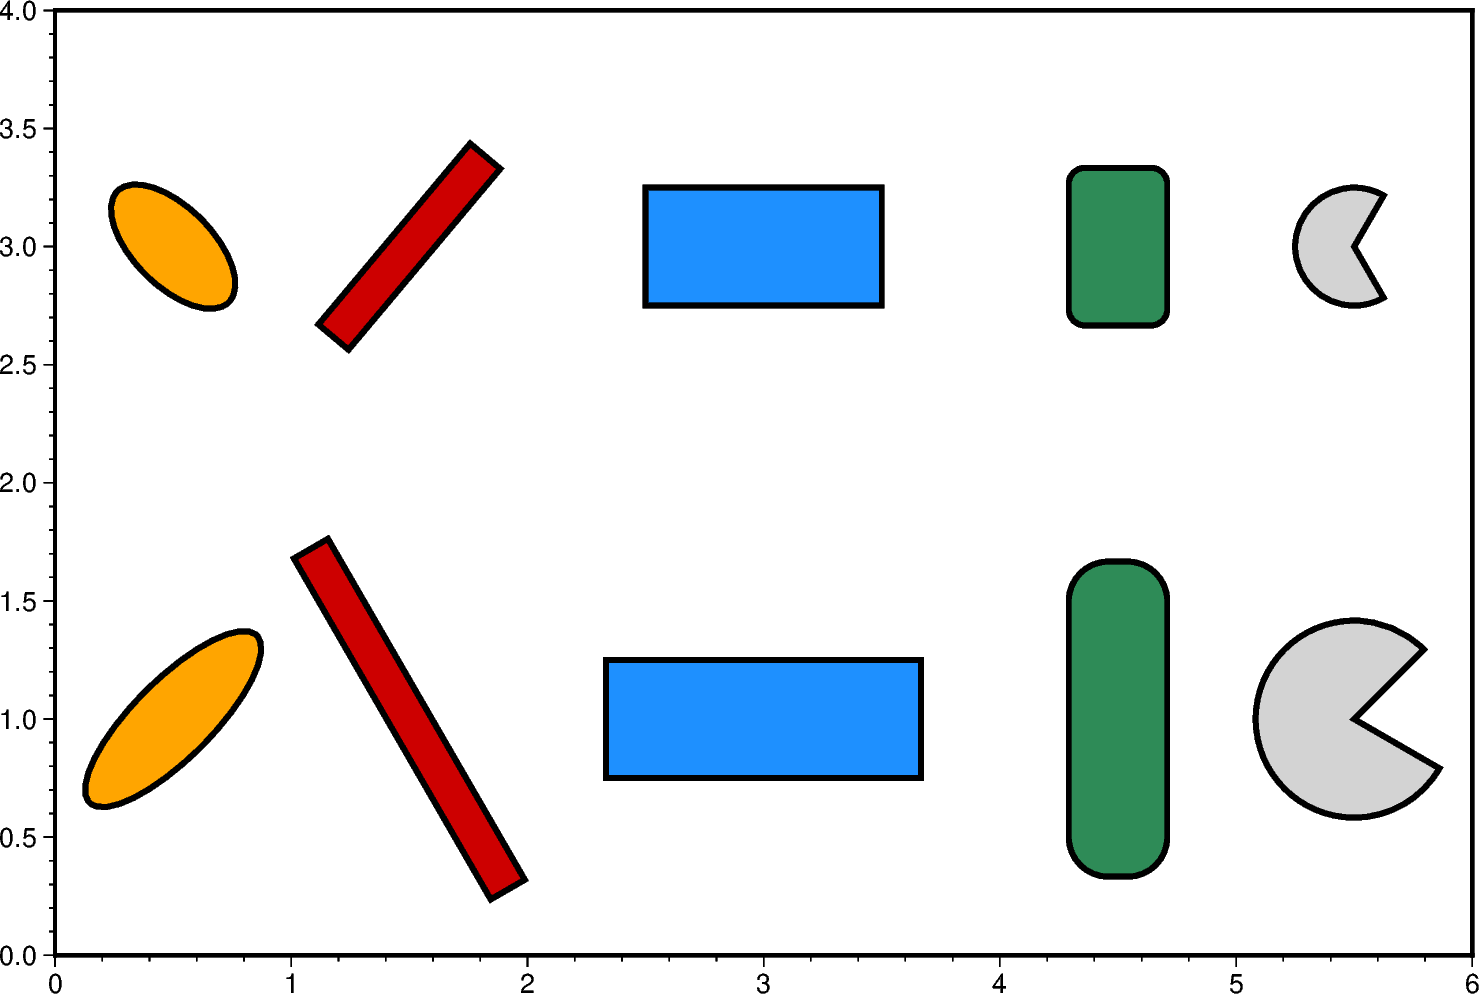
fig = pygmt.Figure()
fig.basemap(region=[0, 6, 0, 4], projection="x3c", frame=["xa1f0.2", "ya0.5f0.1"])

# Ellipse
data = [[0.5, 1, 45, 3, 1], [0.5, 3, 135, 2, 1]]
fig.plot(data=data, style="e", color="orange", pen="2p,black")
# Rotated rectangle
data = [[1.5, 1, 120, 5, 0.5], [1.5, 3, 50, 3, 0.5]]
fig.plot(data=data, style="j", color="red3", pen="2p,black")
# Rectangle
data = [[3, 1, 4, 1.5], [3, 3, 3, 1.5]]
fig.plot(data=data, style="r", color="dodgerblue", pen="2p,black")
# Rounded rectangle
data = [[4.5, 1, 1.25, 4, 0.5], [4.5, 3, 1.25, 2.0, 0.2]]
fig.plot(data=data, style="R", color="seagreen", pen="2p,black")
# Pie wedge
data = [[5.5, 1, 2.5, 45, 330], [5.5, 3, 1.5, 60, 300]]
fig.plot(data=data, style="w", color="lightgray", pen="2p,black")

fig.show()
Out:
<IPython.core.display.Image object>
Total running time of the script: ( 0 minutes 2.809 seconds)