pygmt.grdclip
- pygmt.grdclip(grid, *, outgrid=None, region=None, above=None, below=None, between=None, new=None, verbose=None, **kwargs)[source]
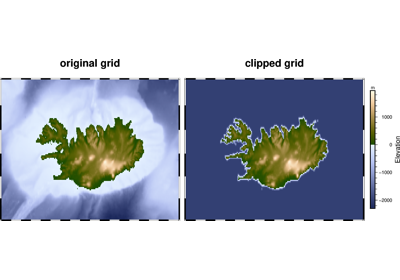
Sets values in a grid that meet certain criteria to a new value.
Produce a clipped
outgridorxarray.DataArrayversion of the inputgridfile.The parameters
aboveandbelowallow for a given value to be set for values above or below a set amount, respectively. This allows for extreme values in a grid, such as points below a certain depth when plotting Earth relief, to all be set to the same value.Full option list at https://docs.generic-mapping-tools.org/latest/grdclip.html
Aliases:
G = outgrid
R = region
Sa = above
Sb = below
Si = between
Sr = new
V = verbose
- Parameters
grid (str or xarray.DataArray) – The file name of the input grid or the grid loaded as a DataArray.
outgrid (str or None) – The name of the output netCDF file with extension .nc to store the grid in.
region (str or list) – xmin/xmax/ymin/ymax[+r][+uunit]. Specify the region of interest.
above (str or list or tuple) – [high, above]. Set all data[i] > high to above.
below (str or list or tuple) – [low, below]. Set all data[i] < low to below.
between (str or list or tuple) – [low, high, between]. Set all data[i] >= low and <= high to between.
new (str or list or tuple) – [old, new]. Set all data[i] == old to new. This is mostly useful when your data are known to be integer values.
Select verbosity level [Default is w], which modulates the messages written to stderr. Choose among 7 levels of verbosity:
q - Quiet, not even fatal error messages are produced
e - Error messages only
w - Warnings [Default]
t - Timings (report runtimes for time-intensive algorithms);
i - Informational messages (same as
verbose=True)c - Compatibility warnings
d - Debugging messages
- Returns
ret (xarray.DataArray or None) – Return type depends on whether the
outgridparameter is set:xarray.DataArrayifoutgridis not setNone if
outgridis set (grid output will be stored in file set byoutgrid)
Example
>>> import pygmt
>>> # Load a grid of @earth_relief_30m data, with an x-range of 10 to 30,
>>> # and a y-range of 15 to 25
>>> grid = pygmt.datasets.load_earth_relief(
...     resolution="30m", region=[10, 30, 15, 25]
... )
>>> # Report the minimum and maximum data values
>>> [grid.data.min(), grid.data.max()]
[179.0, 2103.0]
>>> # Create a new grid from an input grid. Set all values below 1,000 to
>>> # 0 and all values above 1,500 to 10,000
>>> new_grid = pygmt.grdclip(
...     grid=grid, below=[1000, 0], above=[1500, 10000]
... )
>>> # Report the minimum and maximum data values
>>> [new_grid.data.min(), new_grid.data.max()]
[0.0, 10000.0]