Note
Click here to download the full example code
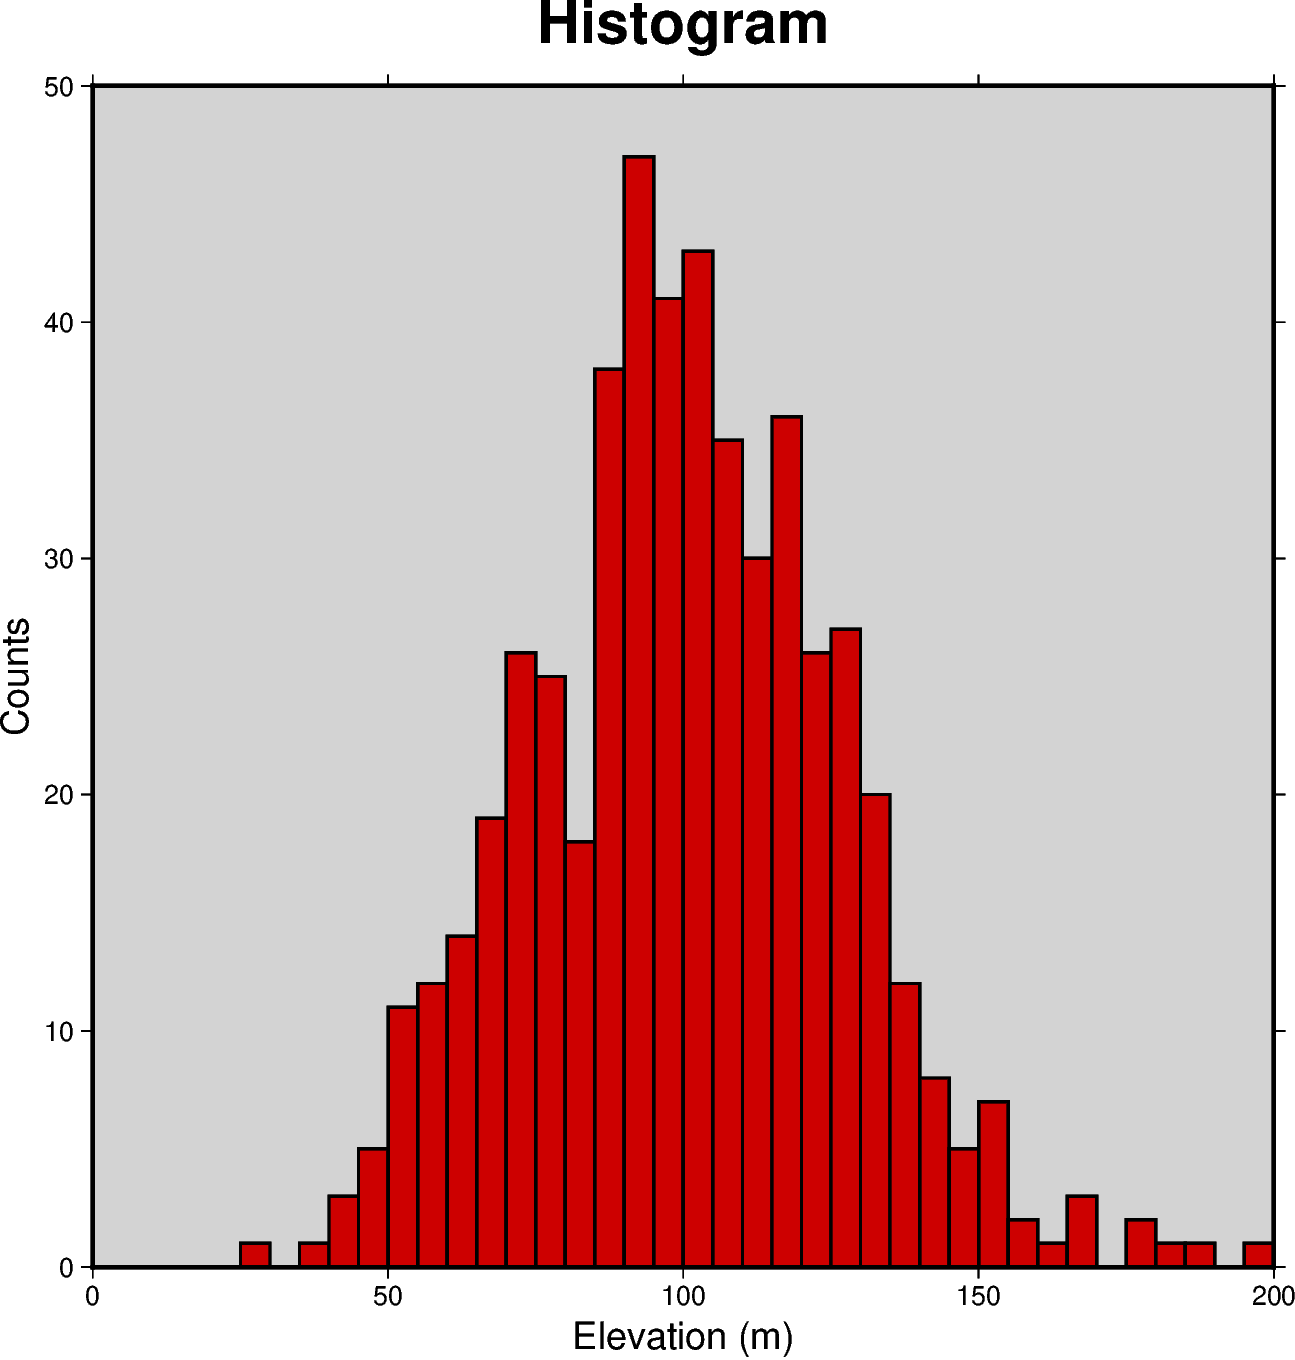
Histogram
The pygmt.Figure.histogram method can plot regular histograms.
Using the series parameter allows to set the interval for the width of
each bar. The type of histogram (frequency count or percentage) can be
selected via the histtype parameter.
Out:
<IPython.core.display.Image object>
import numpy as np
import pygmt

np.random.seed(100)

# generate random elevation data from a normal distribution
mean = 100  # mean of distribution
stddev = 25  # standard deviation of distribution
data = mean + stddev * np.random.randn(521)

fig = pygmt.Figure()

fig.histogram(
    data=data,
    # define the frame, add title and set background color to
    # lightgray, add annotations for x and y axis
    frame=['WSne+t"Histogram"+glightgray', 'x+l"Elevation (m)"', 'y+l"Counts"'],
    # generate evenly spaced bins by increments of 5
    series=5,
    # use red3 as color fill for the bars
    fill="red3",
    # use a pen size of 1p to draw the outlines
    pen="1p",
    # choose histogram type 0 = counts [default]
    histtype=0,
)

fig.show()
Total running time of the script: ( 0 minutes 1.090 seconds)