Note
Click here to download the full example code
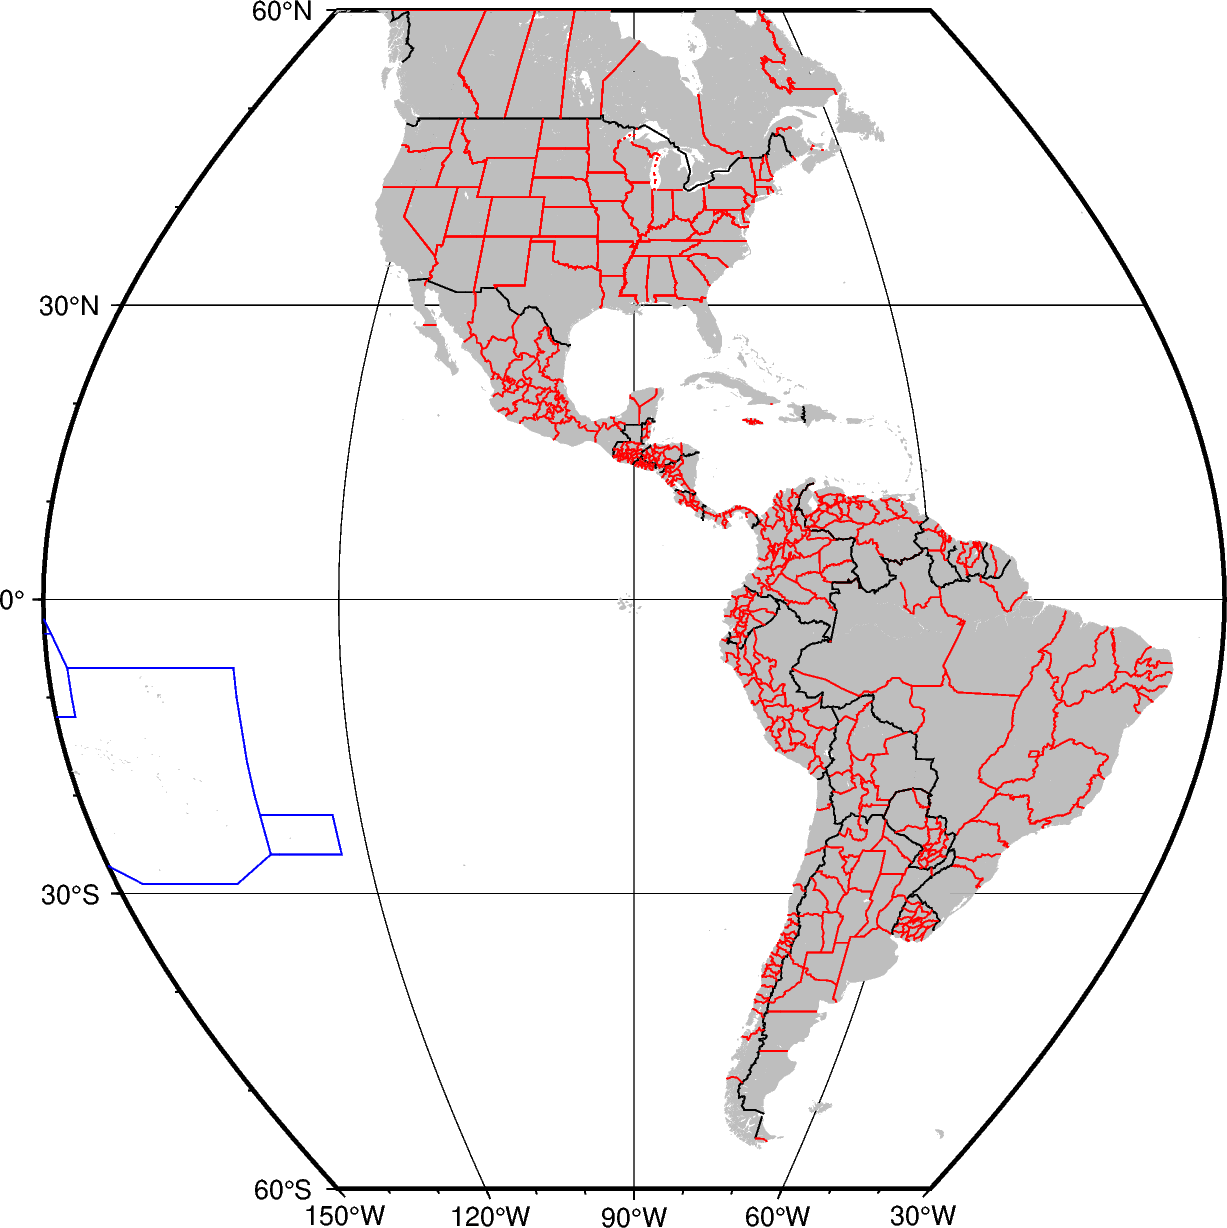
Political Boundaries
The borders parameter of pygmt.Figure.coast specifies levels of
political boundaries to plot and the pen used to draw them. Choose from the
list of boundaries below:
1 = National boundaries
2 = State boundaries within the Americas
3 = Marine boundaries
a = All boundaries (1-3)
For example, to draw national boundaries with a line thickness of 1p and black
line color use borders="1/1p,black". You can draw multiple boundaries by
passing in a list to borders.
Out:
<IPython.core.display.Image object>
import pygmt

fig = pygmt.Figure()
# Make a Sinusoidal projection map of the Americas with automatic annotations,
# ticks and gridlines
fig.basemap(region=[-150, -30, -60, 60], projection="I-90/15c", frame="afg")
# Plot each level of the boundaries dataset with a different color.
fig.coast(borders=["1/0.5p,black", "2/0.5p,red", "3/0.5p,blue"], land="gray")
fig.show()
Total running time of the script: ( 0 minutes 1.410 seconds)