Note
Click here to download the full example code
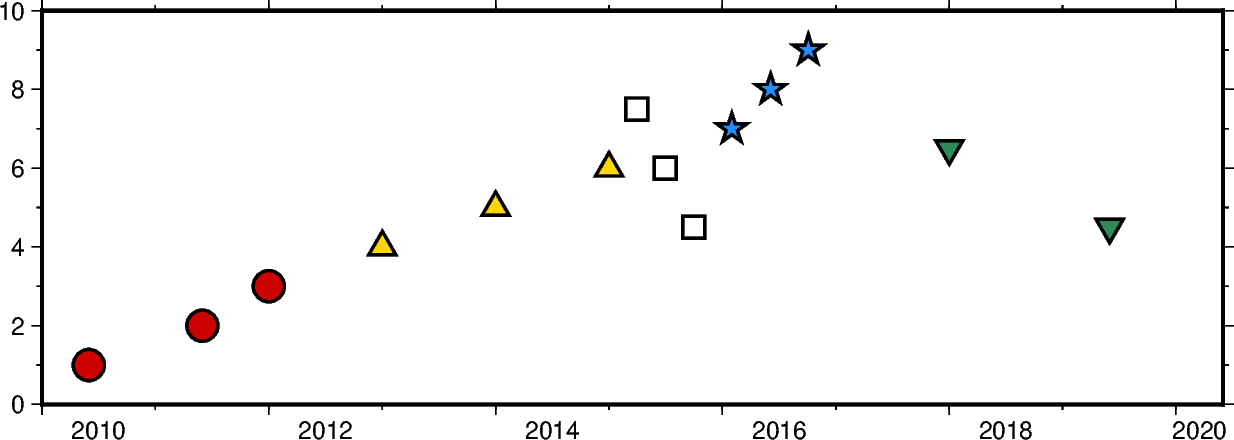
Datetime inputs
Datetime inputs of the following types are supported in PyGMT:
xarray.DataArray: datetimes included in a xarray.DataArrayraw datetime strings in ISO 8601 format (e.g.
"YYYY-MM-DD","YYYY-MM-DDTHH", and"YYYY-MM-DDTHH:MM:SS")Python built-in
datetime.datetimeanddatetime.date
We can pass datetime inputs based on one of the types listed above directly to
the x and y parameters of e.g. the pygmt.Figure.plot method.
The region parameter has to include the \(x\) and \(y\) axis limits
in the form [date_min, date_max, ymin, ymax]. Here date_min and
date_max can be directly defined as datetime input.
Out:
<IPython.core.display.Image object>
import datetime

import numpy as np
import pandas as pd
import pygmt
import xarray as xr

fig = pygmt.Figure()

# create a basemap with limits of 2010-01-01 to 2020-06-01 on the x axis and
# 0 to 10 on the y axis
fig.basemap(
    projection="X15c/5c",
    region=[datetime.date(2010, 1, 1), datetime.date(2020, 6, 1), 0, 10],
    frame=["WSen", "af"],
)

# numpy.datetime64 types
x = np.array(["2010-06-01", "2011-06-01T12", "2012-01-01T12:34:56"], dtype="datetime64")
y = [1, 2, 3]
fig.plot(x=x, y=y, style="c0.4c", pen="1p", color="red3")

# pandas.DatetimeIndex
x = pd.date_range("2013", periods=3, freq="YS")
y = [4, 5, 6]
fig.plot(x=x, y=y, style="t0.4c", pen="1p", color="gold")

# xarray.DataArray
x = xr.DataArray(data=pd.date_range(start="2015-03", periods=3, freq="QS"))
y = [7.5, 6, 4.5]
fig.plot(x=x, y=y, style="s0.4c", pen="1p")

# raw datetime strings
x = ["2016-02-01", "2016-06-04T14", "2016-10-04T00:00:15"]
y = [7, 8, 9]
fig.plot(x=x, y=y, style="a0.4c", pen="1p", color="dodgerblue")

# the Python built-in datetime and date
x = [datetime.date(2018, 1, 1), datetime.datetime(2019, 6, 1, 20, 5, 45)]
y = [6.5, 4.5]
fig.plot(x=x, y=y, style="i0.4c", pen="1p", color="seagreen")

fig.show()
Total running time of the script: ( 0 minutes 1.401 seconds)