pygmt.Figure.solar
- Figure.solar(terminator='d', terminator_datetime=None, *, frame=None, fill=None, projection=None, region=None, timestamp=None, verbose=None, pen=None, xshift=None, yshift=None, panel=None, perspective=None, transparency=None, **kwargs)
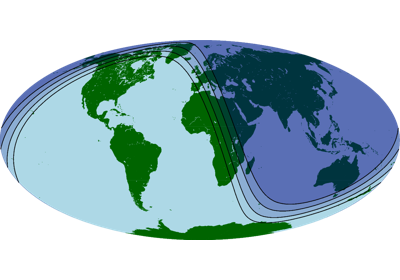
Plot day-light terminators or twilights.
This function plots the day-night terminator. Alternatively, it can plot the terminators for civil twilight, nautical twilight, or astronomical twilight.
Full option list at https://docs.generic-mapping-tools.org/latest/solar.html
Aliases:
B = frame
G = fill
J = projection
R = region
U = timestamp
V = verbose
W = pen
X = xshift
Y = yshift
c = panel
p = perspective
t = transparency
- Parameters
terminator (str) –
Set the type of terminator displayed. Valid arguments are day_night, civil, nautical, and astronomical, which can be set with either the full name or the first letter of the name. [Default is day_night]
Refer to https://en.wikipedia.org/wiki/Twilight for the definitions of different types of twilight.
terminator_datetime (str or datetime object) – Set the UTC date and time of the displayed terminator. It can be passed as a string or Python datetime object. [Default is the current UTC date and time]
region (str or list) – xmin/xmax/ymin/ymax[+r][+uunit]. Specify the region of interest.
projection (str) – projcode[projparams/]width. Select map projection.
frame (bool or str or list) – Set map boundary frame and axes attributes.
fill (str) – Color or pattern for filling of terminators.
pen (str) – Set pen attributes for lines. The default pen is
default,black,solid.Select verbosity level [Default is w], which modulates the messages written to stderr. Choose among 7 levels of verbosity:
q - Quiet, not even fatal error messages are produced
e - Error messages only
w - Warnings [Default]
t - Timings (report runtimes for time-intensive algorithms);
i - Informational messages (same as
verbose=True)c - Compatibility warnings
d - Debugging messages
xshift (str) – [a|c|f|r][xshift]. Shift plot origin in x-direction.
yshift (str) – [a|c|f|r][yshift]. Shift plot origin in y-direction. Full documentation is at https://docs.generic-mapping-tools.org/latest/gmt.html#xy-full.
panel (bool or int or list) – [row,col|index]. Select a specific subplot panel. Only allowed when in subplot mode. Use
panel=Trueto advance to the next panel in the selected order. Instead of row,col you may also give a scalar value index which depends on the order you set viaautolabelwhen the subplot was defined. Note: row, col, and index all start at 0.perspective (list or str) – [x|y|z]azim[/elev[/zlevel]][+wlon0/lat0[/z0]][+vx0/y0]. Select perspective view and set the azimuth and elevation angle of the viewpoint. Default is [180, 90]. Full documentation is at https://docs.generic-mapping-tools.org/latest/gmt.html#perspective-full.
transparency (int or float) – Set transparency level, in [0-100] percent range. Default is 0, i.e., opaque. Only visible when PDF or raster format output is selected. Only the PNG format selection adds a transparency layer in the image (for further processing).