pygmt.Figure.wiggle
- Figure.wiggle(data=None, x=None, y=None, z=None, *, frame=None, position=None, color=None, projection=None, region=None, track=None, timestamp=None, verbose=None, pen=None, xshift=None, yshift=None, scale=None, binary=None, panel=None, nodata=None, find=None, coltypes=None, gap=None, header=None, incols=None, perspective=None, transparency=None, wrap=None, **kwargs)
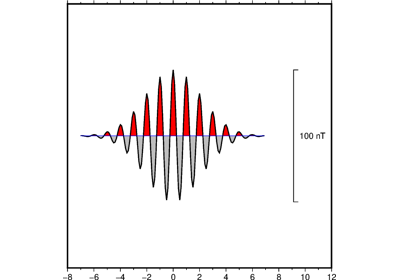
Plot z=f(x,y) anomalies along tracks.
Takes a matrix, (x,y,z) triplets, or a file name as input and plots z as a function of distance along track.
Must provide either
dataorx/y/z.Full option list at https://docs.generic-mapping-tools.org/latest/wiggle.html
Aliases:
B = frame
D = position
G = color
J = projection
R = region
T = track
U = timestamp
V = verbose
W = pen
X = xshift
Y = yshift
Z = scale
b = binary
c = panel
d = nodata
e = find
f = coltypes
g = gap
h = header
i = incols
p = perspective
t = transparency
w = wrap
- Parameters
x/y/z (1d arrays) – The arrays of x and y coordinates and z data points.
data (str or numpy.ndarray or pandas.DataFrame or xarray.Dataset or geopandas.GeoDataFrame) – Pass in either a file name to an ASCII data table, a 2D
numpy.ndarray, apandas.DataFrame, anxarray.Datasetmade up of 1Dxarray.DataArraydata variables, or ageopandas.GeoDataFramecontaining the tabular data. Use parameterincolsto choose which columns are x, y, z, respectively.projection (str) – projcode[projparams/]width. Select map projection.
region (str or list) – xmin/xmax/ymin/ymax[+r][+uunit]. Specify the region of interest.
scale (str or float) – Gives anomaly scale in data-units/distance-unit. Append c, i, or p to indicate the distance unit (cm, inch, or point); if no unit is given we use the default unit that is controlled by PROJ_LENGTH_UNIT.
frame (bool or str or list) – Set map boundary frame and axes attributes.
position (str) – [g|j|J|n|x]refpoint+wlength[+jjustify][+al|r][+odx[/dy]][+l[label]]. Defines the reference point on the map for the vertical scale bar.
color (str) – Set fill shade, color or pattern for positive and/or negative wiggles [Default is no fill]. Optionally, append +p to fill positive areas (this is the default behavior). Append +n to fill negative areas. Append +n+p to fill both positive and negative areas with the same fill. Note: You will need to repeat the color parameter to select different fills for the positive and negative wiggles.
track (str) – Draw track [Default is no track]. Append pen attributes to use [Default is 0.25p,black,solid].
Select verbosity level [Default is w], which modulates the messages written to stderr. Choose among 7 levels of verbosity:
q - Quiet, not even fatal error messages are produced
e - Error messages only
w - Warnings [Default]
t - Timings (report runtimes for time-intensive algorithms);
i - Informational messages (same as
verbose=True)c - Compatibility warnings
d - Debugging messages
pen (str) – Specify outline pen attributes [Default is no outline].
xshift (str) – [a|c|f|r][xshift]. Shift plot origin in x-direction.
yshift (str) – [a|c|f|r][yshift]. Shift plot origin in y-direction. Full documentation is at https://docs.generic-mapping-tools.org/latest/gmt.html#xy-full.
i|o[ncols][type][w][+l|b]. Select native binary input (using
binary="i") or output (usingbinary="o"), where ncols is the number of data columns of type, which must be one of:c - int8_t (1-byte signed char)
u - uint8_t (1-byte unsigned char)
h - int16_t (2-byte signed int)
H - uint16_t (2-byte unsigned int)
i - int32_t (4-byte signed int)
I - uint32_t (4-byte unsigned int)
l - int64_t (8-byte signed int)
L - uint64_t (8-byte unsigned int)
f - 4-byte single-precision float
d - 8-byte double-precision float
x - use to skip ncols anywhere in the record
For records with mixed types, append additional comma-separated combinations of ncols type (no space). The following modifiers are supported:
w after any item to force byte-swapping.
+l|b to indicate that the entire data file should be read as little- or big-endian, respectively.
Full documentation is at https://docs.generic-mapping-tools.org/latest/gmt.html#bi-full.
panel (bool or int or list) – [row,col|index]. Select a specific subplot panel. Only allowed when in subplot mode. Use
panel=Trueto advance to the next panel in the selected order. Instead of row,col you may also give a scalar value index which depends on the order you set viaautolabelwhen the subplot was defined. Note: row, col, and index all start at 0.nodata (str) – i|onodata. Substitute specific values with NaN (for tabular data). For example,
d="-9999"will replace all values equal to -9999 with NaN during input and all NaN values with -9999 during output. Prepend i to the nodata value for input columns only. Prepend o to the nodata value for output columns only.find (str) – [~]“pattern” | [~]/regexp/[i]. Only pass records that match the given pattern or regular expressions [Default processes all records]. Prepend ~ to the pattern or regexp to instead only pass data expressions that do not match the pattern. Append i for case insensitive matching. This does not apply to headers or segment headers.
coltypes (str) – [i|o]colinfo. Specify data types of input and/or output columns (time or geographical data). Full documentation is at https://docs.generic-mapping-tools.org/latest/gmt.html#f-full.
x|y|z|d|X|Y|Dgap[u][+a][+ccol][+n|p]. Examine the spacing between consecutive data points in order to impose breaks in the line. To specify multiple criteria, provide a list with each item containing a string describing one set of criteria.
x|X - define a gap when there is a large enough change in the x coordinates (upper case to use projected coordinates).
y|Y - define a gap when there is a large enough change in the y coordinates (upper case to use projected coordinates).
d|D - define a gap when there is a large enough distance between coordinates (upper case to use projected coordinates).
z - define a gap when there is a large enough change in the z data. Use +ccol to change the z data column [Default col is 2 (i.e., 3rd column)].
A unit u may be appended to the specified gap:
For geographic data (x|y|d), the unit may be arc d(egree), m(inute), and s(econd), or (m)e(ter), f(eet), k(ilometer), M(iles), or n(autical miles) [Default is (m)e(ter)].
For projected data (X|Y|D), the unit may be i(nch), c(entimeter), or p(oint).
Append modifier +a to specify that all the criteria must be met [default imposes breaks if any one criterion is met].
One of the following modifiers can be appended:
+n - specify that the previous value minus the current column value must exceed gap for a break to be imposed.
+p - specify that the current value minus the previous value must exceed gap for a break to be imposed.
header (str) –
[i|o][n][+c][+d][+msegheader][+rremark][+ttitle]. Specify that input and/or output file(s) have n header records [Default is 0]. Prepend i if only the primary input should have header records. Prepend o to control the writing of header records, with the following modifiers supported:
+d to remove existing header records.
+c to add a header comment with column names to the output [Default is no column names].
+m to add a segment header segheader to the output after the header block [Default is no segment header].
+r to add a remark comment to the output [Default is no comment]. The remark string may contain \n to indicate line-breaks.
+t to add a title comment to the output [Default is no title]. The title string may contain \n to indicate line-breaks.
Blank lines and lines starting with # are always skipped.
incols (str or 1d array) –
Specify data columns for primary input in arbitrary order. Columns can be repeated and columns not listed will be skipped [Default reads all columns in order, starting with the first (i.e., column 0)].
For 1d array: specify individual columns in input order (e.g.,
incols=[1,0]for the 2nd column followed by the 1st column).For
str: specify individual columns or column ranges in the format start[:inc]:stop, where inc defaults to 1 if not specified, with columns and/or column ranges separated by commas (e.g.,incols="0:2,4+l"to input the first three columns followed by the log-transformed 5th column). To read from a given column until the end of the record, leave off stop when specifying the column range. To read trailing text, add the column t. Append the word number to t to ingest only a single word from the trailing text. Instead of specifying columns, useincols="n"to simply read numerical input and skip trailing text. Optionally, append one of the following modifiers to any column or column range to transform the input columns:+l to take the log10 of the input values.
+d to divide the input values by the factor divisor [Default is 1].
+s to multiple the input values by the factor scale [Default is 1].
+o to add the given offset to the input values [Default is 0].
perspective (list or str) – [x|y|z]azim[/elev[/zlevel]][+wlon0/lat0[/z0]][+vx0/y0]. Select perspective view and set the azimuth and elevation angle of the viewpoint. Default is [180, 90]. Full documentation is at https://docs.generic-mapping-tools.org/latest/gmt.html#perspective-full.
transparency (int or float) – Set transparency level, in [0-100] percent range. Default is 0, i.e., opaque. Only visible when PDF or raster format output is selected. Only the PNG format selection adds a transparency layer in the image (for further processing).
wrap (str) –
y|a|w|d|h|m|s|cperiod[/phase][+ccol]. Convert the input x-coordinate to a cyclical coordinate, or a different column if selected via +ccol. The following cyclical coordinate transformations are supported:
y - yearly cycle (normalized)
a - annual cycle (monthly)
w - weekly cycle (day)
d - daily cycle (hour)
h - hourly cycle (minute)
m - minute cycle (second)
s - second cycle (second)
c - custom cycle (normalized)
Full documentation is at https://docs.generic-mapping-tools.org/latest/gmt.html#w-full.