pygmt.Figure.grdcontour
- Figure.grdcontour(grid, *, annotation=None, frame=None, interval=None, label_placement=None, projection=None, limit=None, cut=None, region=None, resample=None, timestamp=None, verbose=None, pen=None, label=None, xshift=None, yshift=None, panel=None, coltypes=None, perspective=None, transparency=None, **kwargs)
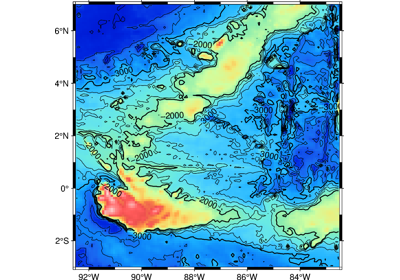
Convert grids or images to contours and plot them on maps.
Takes a grid file name or an xarray.DataArray object as input.
Full option list at https://docs.generic-mapping-tools.org/latest/grdcontour.html
Aliases:
A = annotation
B = frame
C = interval
G = label_placement
J = projection
L = limit
Q = cut
R = region
S = resample
U = timestamp
V = verbose
W = pen
X = xshift
Y = yshift
c = panel
f = coltypes
l = label
p = perspective
t = transparency
- Parameters
grid (str or xarray.DataArray) – The file name of the input grid or the grid loaded as a DataArray.
Specify the contour lines to generate.
The filename of a CPT file where the color boundaries will be used as contour levels.
The filename of a 2 (or 3) column file containing the contour levels (col 1), (C)ontour or (A)nnotate (col 2), and optional angle (col 3)
A fixed contour interval cont_int or a single contour with +cont_int
annotation (str, int, or list) –
Specify or disable annotated contour levels, modifies annotated contours specified in
interval.Specify a fixed annotation interval annot_int or a single annotation level +annot_int
Disable all annotation with -
Optional label modifiers can be specified as a single string
'[annot_int]+e'or with a list of arguments([annot_int], 'e', 'f10p', 'gred').
limit (str or list of 2 ints) – low/high. Do no draw contours below low or above high, specify as string
cut (str or int) – Do not draw contours with less than cut number of points.
projection (str) – projcode[projparams/]width. Select map projection.
region (str or list) – xmin/xmax/ymin/ymax[+r][+uunit]. Specify the region of interest.
frame (bool or str or list) – Set map boundary frame and axes attributes.
label_placement (str) – [d|f|n|l|L|x|X]args. Control the placement of labels along the quoted lines. It supports five controlling algorithms. See https://docs.generic-mapping-tools.org/latest/grdcontour.html#g for details.
Select verbosity level [Default is w], which modulates the messages written to stderr. Choose among 7 levels of verbosity:
q - Quiet, not even fatal error messages are produced
e - Error messages only
w - Warnings [Default]
t - Timings (report runtimes for time-intensive algorithms);
i - Informational messages (same as
verbose=True)c - Compatibility warnings
d - Debugging messages
pen (str) – Set pen attributes for lines or the outline of symbols.
xshift (str) – [a|c|f|r][xshift]. Shift plot origin in x-direction.
yshift (str) – [a|c|f|r][yshift]. Shift plot origin in y-direction. Full documentation is at https://docs.generic-mapping-tools.org/latest/gmt.html#xy-full.
panel (bool or int or list) – [row,col|index]. Select a specific subplot panel. Only allowed when in subplot mode. Use
panel=Trueto advance to the next panel in the selected order. Instead of row,col you may also give a scalar value index which depends on the order you set viaautolabelwhen the subplot was defined. Note: row, col, and index all start at 0.coltypes (str) – [i|o]colinfo. Specify data types of input and/or output columns (time or geographical data). Full documentation is at https://docs.generic-mapping-tools.org/latest/gmt.html#f-full.
label (str) – Add a legend entry for the contour being plotted. Normally, the annotated contour is selected for the legend. You can select the regular contour instead, or both of them, by considering the label to be of the format [annotcontlabel][/contlabel]. If either label contains a slash (/) character then use
|as the separator for the two labels instead.perspective (list or str) – [x|y|z]azim[/elev[/zlevel]][+wlon0/lat0[/z0]][+vx0/y0]. Select perspective view and set the azimuth and elevation angle of the viewpoint. Default is [180, 90]. Full documentation is at https://docs.generic-mapping-tools.org/latest/gmt.html#perspective-full.
transparency (int or float) – Set transparency level, in [0-100] percent range. Default is 0, i.e., opaque. Only visible when PDF or raster format output is selected. Only the PNG format selection adds a transparency layer in the image (for further processing).