Note
Click here to download the full example code
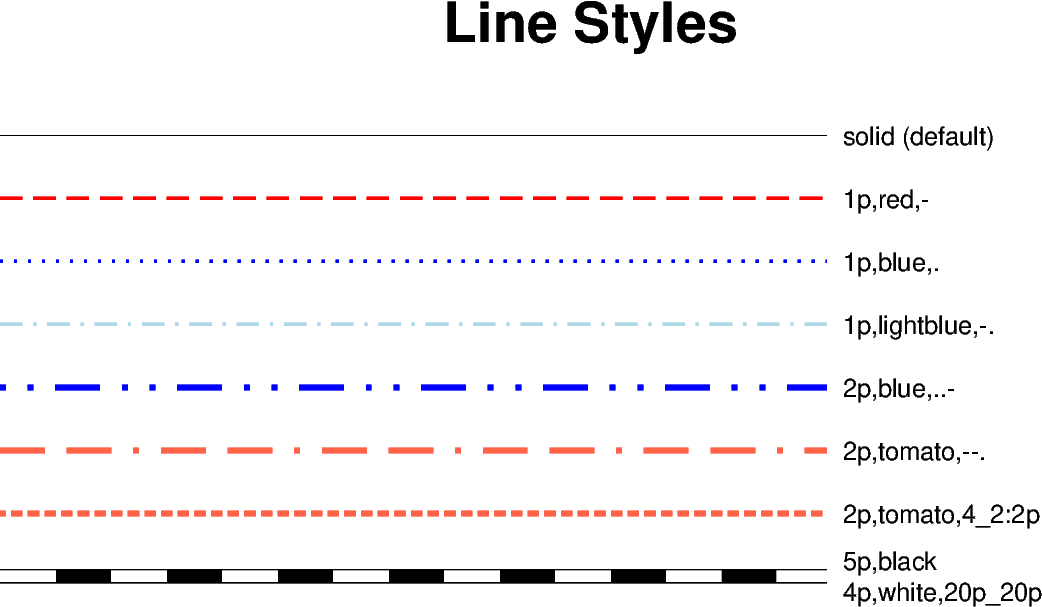
Line styles
The pygmt.Figure.plot method can plot lines in different styles.
The default line style is a 0.25-point wide, black, solid line, and can be
customized with the pen parameter.
A pen in GMT has three attributes: width, color, and style. The style attribute controls the appearance of the line. Giving “dotted” or “.” yields a dotted line, whereas a dashed pen is requested with “dashed” or “-”. Also combinations of dots and dashes, like “.-” for a dot-dashed line, are allowed.
For more advanced pen attributes, see the GMT cookbook https://docs.generic-mapping-tools.org/latest/cookbook/features.html#wpen-attrib.
Out:
<IPython.core.display.Image object>
import numpy as np
import pygmt

# Generate a two-point line for plotting
x = np.array([0, 7])
y = np.array([9, 9])

fig = pygmt.Figure()
fig.basemap(region=[0, 10, 0, 10], projection="X15c/8c", frame='+t"Line Styles"')

# Plot the line using the default line style
fig.plot(x=x, y=y)
fig.text(x=x[-1], y=y[-1], text="solid (default)", justify="ML", offset="0.2c/0c")

# Plot the line using different line styles
for linestyle in [
    "1p,red,-",  # dashed line
    "1p,blue,.",  # dotted line
    "1p,lightblue,-.",  # dash-dotted line
    "2p,blue,..-",  # dot-dot-dashed line
    "2p,tomato,--.",  # dash-dash-dotted line
    # A pattern of 4-point-long line segments and 2-point-long gaps between
    # segments, with pattern offset by 2 points from the origin
    "2p,tomato,4_2:2p",
]:
    y -= 1  # Move the current line down
    fig.plot(x=x, y=y, pen=linestyle)
    fig.text(x=x[-1], y=y[-1], text=linestyle, justify="ML", offset="0.2c/0c")

# Plot the line like a railway track (black/white).
# The trick here is plotting the same line twice but with different line styles
y -= 1  # move the current line down
fig.plot(x=x, y=y, pen="5p,black")
fig.plot(x=x, y=y, pen="4p,white,20p_20p")
fig.text(x=x[-1], y=y[-1], text="5p,black", justify="ML", offset="0.2c/0.2c")
fig.text(x=x[-1], y=y[-1], text="4p,white,20p_20p", justify="ML", offset="0.2c/-0.2c")

fig.show()
Total running time of the script: ( 0 minutes 2.867 seconds)