Note
Click here to download the full example code
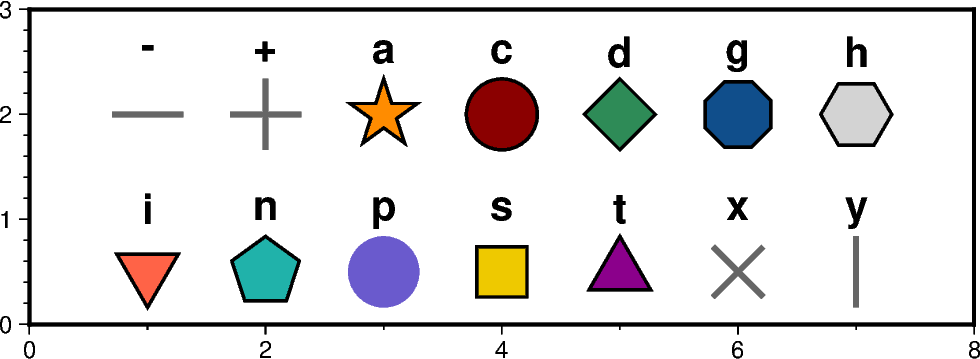
Basic geometric symbols
The pygmt.Figure.plot method can plot individual geometric symbols
by passing the corresponding shortcuts to the style parameter. The 14 basic
geometric symbols are shown underneath their corresponding shortcut codes.
Four symbols (-, +, x and y) are line-symbols only for which we
can adjust the linewidth via the pen parameter. The point symbol (p)
only takes a color fill which we can define via the color parameter. For
the remaining symbols we may define a linewidth as well as a color fill.
Out:
<IPython.core.display.Image object>
import pygmt

fig = pygmt.Figure()
fig.basemap(region=[0, 8, 0, 3], projection="X12c/4c", frame=True)

# define fontstlye for annotations
font = "15p,Helvetica-Bold"

# upper row
y = 2

# use a dash in x direction (-) with a size of 0.9 cm,
# linewidth is set to 2p and the linecolor to "gray40"
fig.plot(x=1, y=y, style="-0.9c", pen="2p,gray40")
fig.text(x=1, y=y + 0.6, text="-", font=font)

# use a plus (+) with a size of 0.9 cm,
# linewidth is set to 2p and the linecolor to "gray40"
fig.plot(x=2, y=y, style="+0.9c", pen="2p,gray40")
fig.text(x=2, y=y + 0.6, text="+", font=font)

# use a star (a) with a size of 0.9 cm,
# linewidth is set to 1p, the linecolor to "black" (default) and the
# color fill to "darkorange"
fig.plot(x=3, y=y, style="a0.9c", pen="1p,black", color="darkorange")
fig.text(x=3, y=y + 0.6, text="a", font=font)

# use a circle (c) with a size of 0.9 cm,
# linewidth is set to 1p, the linecolor to "black" and the
# color fill to "darkred"
fig.plot(x=4, y=y, style="c0.9c", pen="1p,black", color="darkred")
fig.text(x=4, y=y + 0.6, text="c", font=font)

# use a diamond (d) with a size of 0.9 cm,
# linewidth is set to 1p, the linecolor to "black" and the
# color fill to "seagreen"
fig.plot(x=5, y=y, style="d0.9c", pen="1p,black", color="seagreen")
fig.text(x=5, y=y + 0.6, text="d", font=font)

# use a octagon (g) with a size of 0.9 cm,
# linewidth is set to 1p, the linecolor to "black" and the
# color fill to "dodgerblue4"
fig.plot(x=6, y=y, style="g0.9c", pen="1p,black", color="dodgerblue4")
fig.text(x=6, y=y + 0.6, text="g", font=font)

# use a hexagon (h) with a size of 0.9 cm,
# linewidth is set to 1p, the linecolor to "black" and the
# color fill to "lightgray"
fig.plot(x=7, y=y, style="h0.9c", pen="1p,black", color="lightgray")
fig.text(x=7, y=y + 0.6, text="h", font=font)

# lower row
y = 0.5

# use an inverted triangle (i) with a size of 0.9 cm,
# linewidth is set to 1p, the linecolor to "black" and the
# color fill to "tomato"
fig.plot(x=1, y=y, style="i0.9c", pen="1p,black", color="tomato")
fig.text(x=1, y=y + 0.6, text="i", font=font)

# use pentagon (n) with a size of 0.9 cm,
# linewidth is set to 1p, the linecolor to "black" and the
# color fill to "lightseagreen"
fig.plot(x=2, y=y, style="n0.9c", pen="1p,black", color="lightseagreen")
fig.text(x=2, y=y + 0.6, text="n", font=font)

# use a point (p) with a size of 0.9 cm,
# color fill is set to "lightseagreen"
fig.plot(x=3, y=y, style="p0.9c", color="slateblue")
fig.text(x=3, y=y + 0.6, text="p", font=font)

# use square (s) with a size of 0.9 cm,
# linewidth is set to 1p, the linecolor to "black" and the
# color fill to "gold2"
fig.plot(x=4, y=y, style="s0.9c", pen="1p,black", color="gold2")
fig.text(x=4, y=y + 0.6, text="s", font=font)

# use triangle (t) with a size of 0.9 cm,
# linewidth is set to 1p, the linecolor to "black" and the
# color fill to "magenta4"
fig.plot(x=5, y=y, style="t0.9c", pen="1p,black", color="magenta4")
fig.text(x=5, y=y + 0.6, text="t", font=font)

# use cross (x) with a size of 0.9 cm,
# linewidth is set to 2p and the linecolor to "gray40"
fig.plot(x=6, y=y, style="x0.9c", pen="2p,gray40")
fig.text(x=6, y=y + 0.6, text="x", font=font)

# use a dash in y direction (y) with a size of 0.9 cm,
# linewidth is set to 2p and the linecolor to "gray40"
fig.plot(x=7, y=y, style="y0.9c", pen="2p,gray40")
fig.text(x=7, y=y + 0.6, text="y", font=font)

fig.show()
Total running time of the script: ( 0 minutes 3.932 seconds)