Note
Click here to download the full example code
1. Making your first figure
This tutorial page covers the basics of creating a figure using PyGMT - a
Python wrapper for the Generic Mapping Tools (GMT). It will only use
the coast method for plotting. Later examples will address other PyGMT
methods.
Setting up the development environment
PyGMT can be used in both a Python script and a notebook environment, such as Jupyter. The tutorial’s recommended method is to use a notebook, and the code will be for a notebook environment.
Loading the library
The first step is to import pygmt. All methods and figure generation is
accessible from the pygmt top level package.
import pygmt
Creating a figure
All figure generation in PyGMT is handled by the pygmt.Figure class.
Start a new figure by creating an instance of this class:
fig = pygmt.Figure()
To add to a plot object (fig in this example), the PyGMT module is used
as a method on the class. This example will use the coast method, which
can be used to create a map without any other methods, modules or external
data. The coast method plots the coastlines, borders, and bodies of water
using a database that is included in GMT.
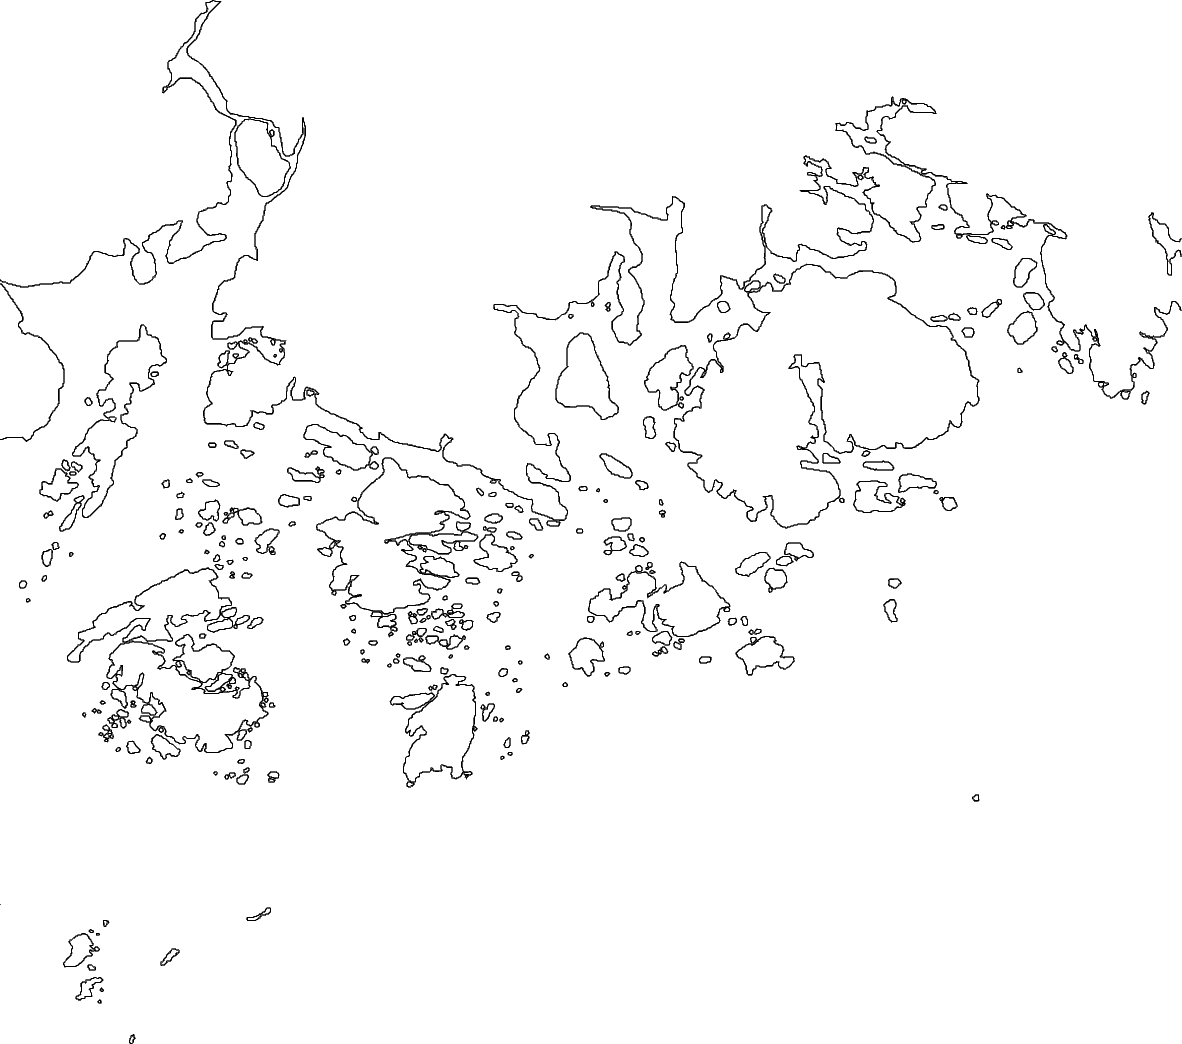
First, a region for the figure must be selected. This example will plot some
of the coast of Maine in the northeastern US. A Python list can be passed to
the region parameter with the minimum and maximum X-values (longitude)
and the minimum and maximum Y-values (latitude). For this example, the
minimum (bottom left) coordinates are (N43.75, W69) and the maximum (top
right) coordinates are (N44.75, W68). Negative values can be passed for
latitudes in the southern hemisphere or longitudes in the western hemisphere.
In addition to the region, an argument needs to be passed to coast to
tell it what to plot. In this example, coast will be told to plot the
shorelines by passing the Boolean value True to the shorelines
parameter. The shorelines parameter has other options for finer control,
but setting it to True uses the default values.
fig.coast(region=[-69, -68, 43.75, 44.75], shorelines=True)
To see the figure, call pygmt.Figure.show.
fig.show()
Out:
<IPython.core.display.Image object>
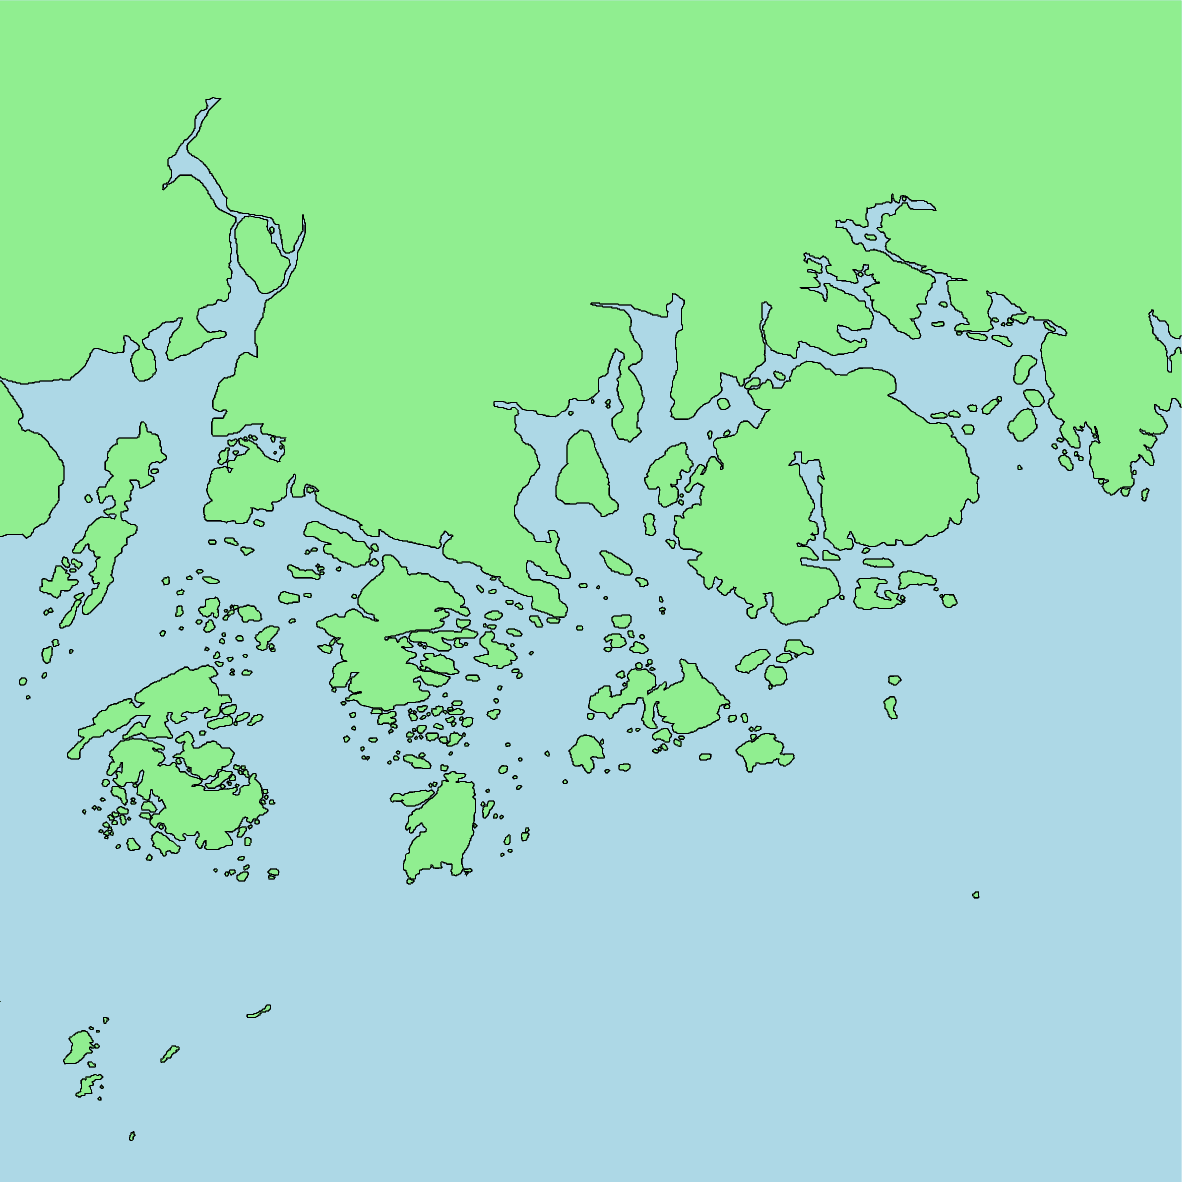
Color the land and water
This figure plots all of the coastlines in the given region, but it does not
indicate where the land and water are. Color values can be passed to land
and water to set the colors on the figure.
When plotting colors in PyGMT, there are multiple
color codes, that can be used. This includes
standard GMT color names (like skyblue), R/G/B levels (like 0/0/255),
a hex value (like #333333), or a graylevel (like 50). For this
example, GMT color names are used.
fig = pygmt.Figure()
fig.coast(
    region=[-69, -68, 43.75, 44.75],
    shorelines=True,
    land="lightgreen",
    water="lightblue",
)
fig.show()
Out:
<IPython.core.display.Image object>
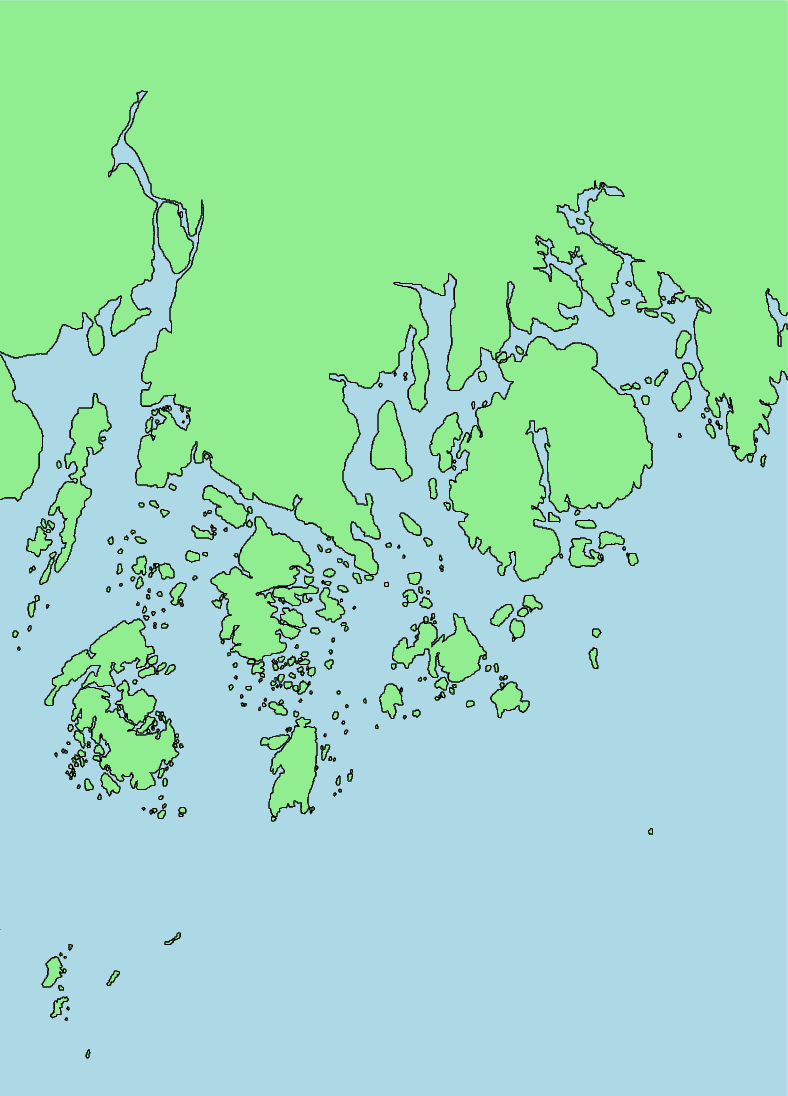
Set the projection
This figure now has its colors set, but there is no projection or size
set for the map. Both of these values are set using the projection
parameter.
The appropriate projection varies for the type of map. The available
projections are explained in the projection
gallery. For this example, the Mercator projection is set using "M".
The width of the figure will be 10 centimeters, as set by "10c". The map
size can also be set in inches using “i” (e.g. a 5 inch wide Mercator
projection would use "M5i").
fig = pygmt.Figure()
fig.coast(
    region=[-69, -68, 43.75, 44.75],
    shorelines=True,
    land="lightgreen",
    water="lightblue",
    projection="M10c",
)
fig.show()
Out:
<IPython.core.display.Image object>
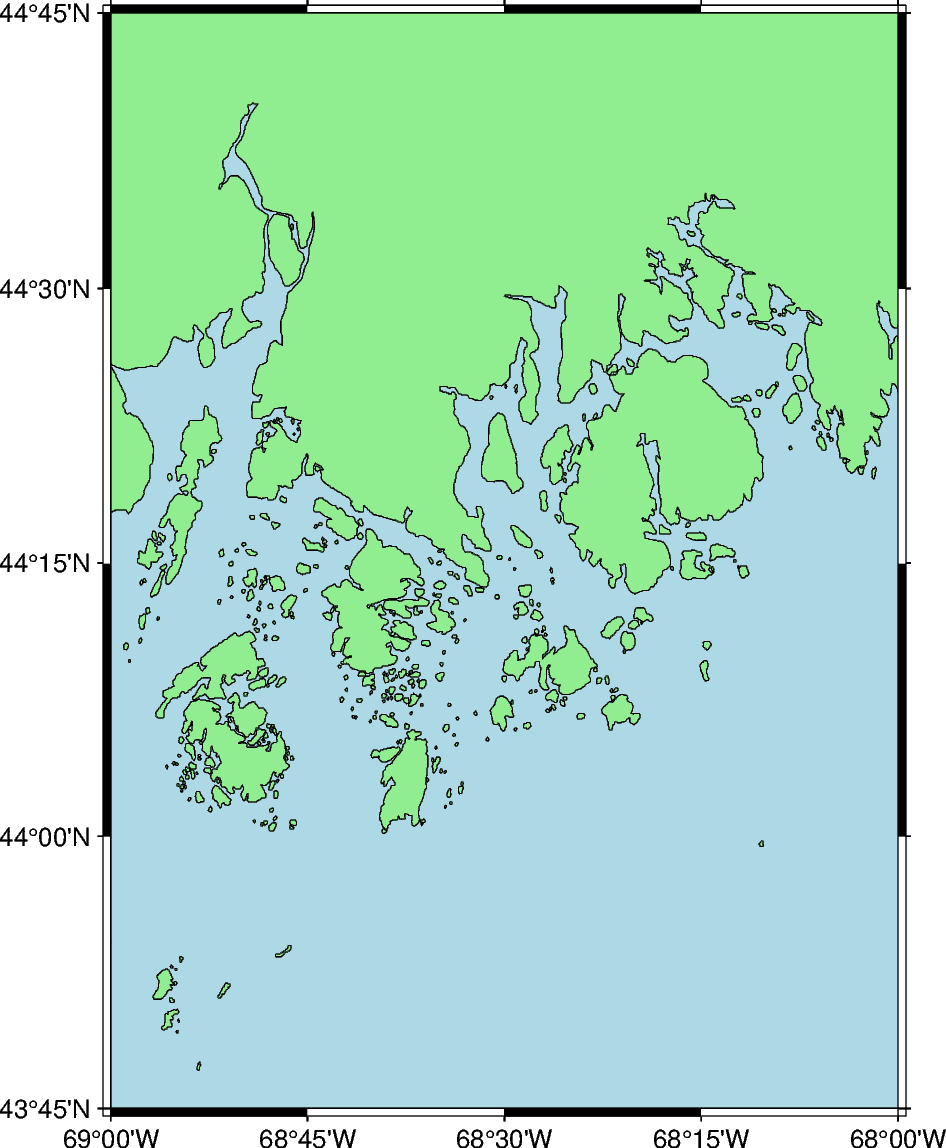
Add a frame
While that the map’s colors, projection, and size have been set, the region that is being displayed is not apparent. A frame can be added to annotate the latitude and longitude of the region.
The frame parameter is used to add a frame to the figure. For now, it
will be set to "a" to annotate the axes automatically.
fig = pygmt.Figure()
fig.coast(
    region=[-69, -68, 43.75, 44.75],
    shorelines=True,
    land="lightgreen",
    water="lightblue",
    projection="M10c",
    frame="a",
)
fig.show()
Out:
<IPython.core.display.Image object>
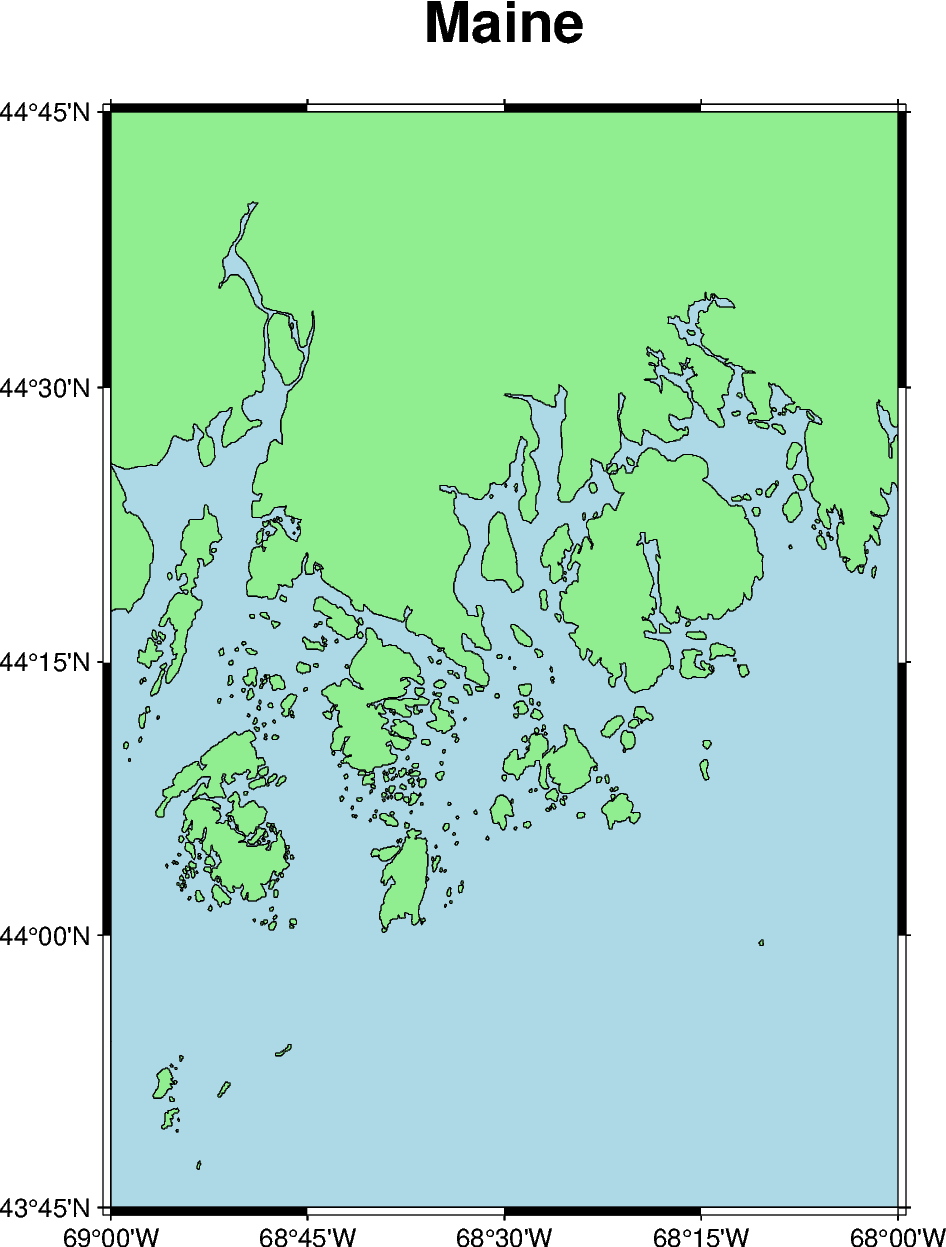
Add a title
The frame parameter can be used to add a title to the figure. The title
is set with by passing "+t" followed by the title (e.g. setting the map
title to “Title” would be "+tTitle").
To pass multiple arguments to frame, a list can be used, as shown in the
example below. This format uses frame to set both the axes gridlines and
the figure title.
fig = pygmt.Figure()
fig.coast(
    region=[-69, -68, 43.75, 44.75],
    shorelines=True,
    land="lightgreen",
    water="lightblue",
    projection="M10c",
    frame=["a", "+tMaine"],
)
fig.show()
Out:
<IPython.core.display.Image object>
Additional exercises
This is the end of the first tutorial. Here are some additional exercises for the concepts that were discussed:
Make a map of Germany using its ISO country code (“DE”). Pass the ISO code as a Python string to the
regionparameter.Change the color of the land to “khaki” and the water to “azure”.
Change the color of the lakes (using the
lakesparameter) to “red”.Create a global map. Set the region to “d” to center the map at the Prime Meridian or “g” to center the map at the International Date Line. When the region is set without using a list full of integers or floating numbers, the argument needs to be passed as a Python string. Create a 15 centimeter map using the Mollwide (“W”) projection.
Total running time of the script: ( 0 minutes 4.846 seconds)