pygmt.Figure.ternary
- Figure.ternary(data, alabel=None, blabel=None, clabel=None, *, frame=None, cmap=None, fill=None, width=None, region=None, style=None, timestamp=None, verbose=None, pen=None, panel=None, perspective=None, transparency=None, **kwargs)
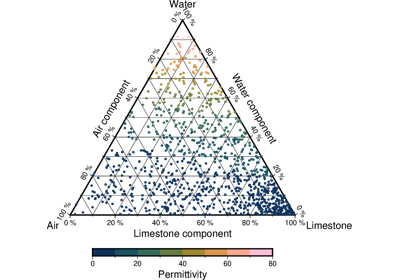
Reads (a,b,c[,z]) records from data and plots symbols at those locations on a ternary diagram. If a symbol is selected and no symbol size given, then we will interpret the fourth column of the input data as symbol size. Symbols whose size is <= 0 are skipped. If no symbols are specified then the symbol code (see
stylebelow) must be present as last column in the input. Ifstyleis not specified then we instead plot lines or polygons.Full option list at https://docs.generic-mapping-tools.org/latest/ternary.html
Aliases:
B = frame
C = cmap
G = fill
JX = width
R = region
S = style
U = timestamp
V = verbose
W = pen
c = panel
p = perspective
t = transparency
- Parameters
data (str or list or numpy.ndarray or pandas.DataFrame or xarray.Dataset or geopandas.GeoDataFrame) – Pass in either a file name to an ASCII data table, a Python list, a 2-D
numpy.ndarray, apandas.DataFrame, anxarray.Datasetmade up of 1-Dxarray.DataArraydata variables, or ageopandas.GeoDataFramecontaining the tabular data.width (str) – Set the width of the figure by passing a number, followed by a unit (i for inches, c for centimeters). Use a negative width to indicate that positive axes directions be clock-wise [Default lets the a, b, c axes be positive in a counter-clockwise direction].
region (str or list) – [amin, amax, bmin, bmax, cmin, cmax]. Give the min and max limits for each of the three axes a, b, and c.
cmap (str) – File name of a CPT file or a series of comma-separated colors (e.g., color1,color2,color3) to build a linear continuous CPT from those colors automatically.
fill (str) – Select color or pattern for filling of symbols or polygons [Default is no fill].
alabel (str) – Set the label for the a vertex where the component is 100%. The label is placed at a distance of three times the MAP_LABEL_OFFSET setting from the corner.
blabel (str) – Set the label for the b vertex where the component is 100%.
clabel (str) – Set the label for the c vertex where the component is 100%.
style (str) – symbol[size]. Plot individual symbols in a ternary diagram.
pen (str) – Set pen attributes for lines or the outline of symbols.
Select verbosity level [Default is w], which modulates the messages written to stderr. Choose among 7 levels of verbosity:
q - Quiet, not even fatal error messages are produced
e - Error messages only
w - Warnings [Default]
t - Timings (report runtimes for time-intensive algorithms)
i - Informational messages (same as
verbose=True)c - Compatibility warnings
d - Debugging messages
panel (bool or int or list) – [row,col|index]. Select a specific subplot panel. Only allowed when in subplot mode. Use
panel=Trueto advance to the next panel in the selected order. Instead of row,col you may also give a scalar value index which depends on the order you set viaautolabelwhen the subplot was defined. Note: row, col, and index all start at 0.perspective (list or str) – [x|y|z]azim[/elev[/zlevel]][+wlon0/lat0[/z0]][+vx0/y0]. Select perspective view and set the azimuth and elevation angle of the viewpoint. Default is [180, 90]. Full documentation is at https://docs.generic-mapping-tools.org/latest/gmt.html#perspective-full.
transparency (int or float) – Set transparency level, in [0-100] percent range [Default is 0, i.e., opaque]. Only visible when PDF or raster format output is selected. Only the PNG format selection adds a transparency layer in the image (for further processing).