pygmt.nearneighbor
- pygmt.nearneighbor(data=None, x=None, y=None, z=None, *, empty=None, outgrid=None, spacing=None, sectors=None, region=None, search_radius=None, verbose=None, aspatial=None, binary=None, nodata=None, find=None, coltypes=None, gap=None, header=None, incols=None, registration=None, wrap=None, **kwargs)[source]
Grid table data using a “Nearest neighbor” algorithm.
nearneighbor reads arbitrarily located (x, y, z[, w]) triplets [quadruplets] and uses a nearest neighbor algorithm to assign a weighted average value to each node that has one or more data points within a search radius centered on the node with adequate coverage across a subset of the chosen sectors. The node value is computed as a weighted mean of the nearest point from each sector inside the search radius. The weighting function and the averaging used is given by:
\[w(r_i) = \frac{w_i}{1 + d(r_i) ^ 2}, \quad d(r) = \frac {3r}{R}, \quad \bar{z} = \frac{\sum_i^n w(r_i) z_i}{\sum_i^n w(r_i)}\]where \(n\) is the number of data points that satisfy the selection criteria and \(r_i\) is the distance from the node to the i’th data point. If no data weights are supplied then \(w_i = 1\).
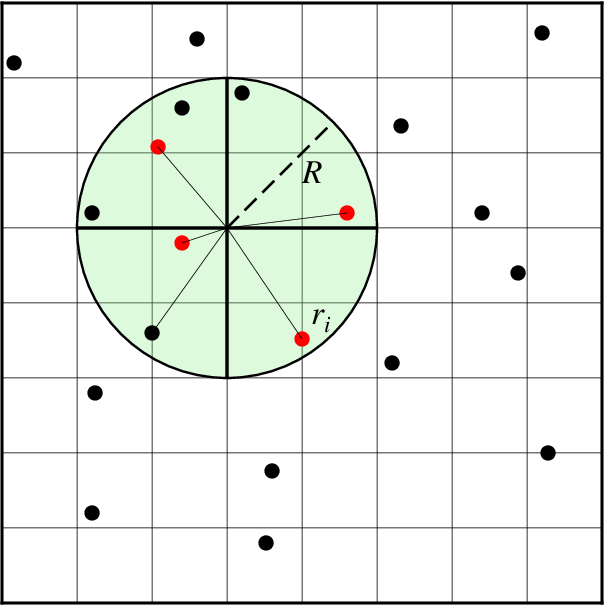
Search geometry includes the search radius (R) which limits the points considered and the number of sectors (here 4), which restricts how points inside the search radius contribute to the value at the node. Only the closest point in each sector (red circles) contribute to the weighted estimate.
Takes a matrix, (x, y, z) triplets, or a file name as input.
Must provide either
dataorx,y, andz.Full option list at https://docs.generic-mapping-tools.org/latest/nearneighbor.html
Aliases:
E = empty
G = outgrid
I = spacing
N = sectors
R = region
S = search_radius
V = verbose
a = aspatial
b = binary
d = nodata
e = find
f = coltypes
g = gap
h = header
i = incols
r = registration
w = wrap
- Parameters
data (str or numpy.ndarray or pandas.DataFrame or xarray.Dataset or geopandas.GeoDataFrame) – Pass in (x, y, z) or (longitude, latitude, elevation) values by providing a file name to an ASCII data table, a 2-D
numpy.ndarray, apandas.DataFrame, anxarray.Datasetmade up of 1-Dxarray.DataArraydata variables, or ageopandas.GeoDataFramecontaining the tabular data.x/y/z (1-D arrays) – Arrays of x and y coordinates and values z of the data points.
spacing (str) –
x_inc[+e|n][/y_inc[+e|n]]. x_inc [and optionally y_inc] is the grid spacing.
Geographical (degrees) coordinates: Optionally, append an increment unit. Choose among m to indicate arc-minutes or s to indicate arc-seconds. If one of the units e, f, k, M, n or u is appended instead, the increment is assumed to be given in meter, foot, km, mile, nautical mile or US survey foot, respectively, and will be converted to the equivalent degrees longitude at the middle latitude of the region (the conversion depends on PROJ_ELLIPSOID). If y_inc is given but set to 0 it will be reset equal to x_inc; otherwise it will be converted to degrees latitude.
All coordinates: If +e is appended then the corresponding max x (east) or y (north) may be slightly adjusted to fit exactly the given increment [by default the increment may be adjusted slightly to fit the given domain]. Finally, instead of giving an increment you may specify the number of nodes desired by appending +n to the supplied integer argument; the increment is then recalculated from the number of nodes, the
registration, and the domain. The resulting increment value depends on whether you have selected a gridline-registered or pixel-registered grid; see GMT File Formats for details.
Note: If
region=grdfileis used then the grid spacing and the registration have already been initialized; usespacingandregistrationto override these values.region (str or list) – xmin/xmax/ymin/ymax[+r][+uunit]. Specify the region of interest.
search_radius (str) – Sets the search radius that determines which data points are considered close to a node.
outgrid (str) – Optional. The file name for the output netcdf file with extension .nc to store the grid in.
empty (str) – Optional. Set the value assigned to empty nodes. Defaults to NaN.
sectors (str) – sectors[+mmin_sectors]|n. Optional. The circular search area centered on each node is divided into sectors sectors. Average values will only be computed if there is at least one value inside each of at least min_sectors of the sectors for a given node. Nodes that fail this test are assigned the value NaN (but see
empty). If +m is omitted then min_sectors is set to be at least 50% of sectors (i.e., rounded up to next integer) [Default is a quadrant search with 100% coverage, i.e., sectors = min_sectors = 4]. Note that only the nearest value per sector enters into the averaging; the more distant points are ignored. Alternatively, usesectors="n"to call GDAL’s nearest neighbor algorithm instead.Select verbosity level [Default is w], which modulates the messages written to stderr. Choose among 7 levels of verbosity:
q - Quiet, not even fatal error messages are produced
e - Error messages only
w - Warnings [Default]
t - Timings (report runtimes for time-intensive algorithms)
i - Informational messages (same as
verbose=True)c - Compatibility warnings
d - Debugging messages
aspatial (bool or str) – [col=]name[,…]. Control how aspatial data are handled during input and output. Full documentation is at https://docs.generic-mapping-tools.org/latest/gmt.html#aspatial-full.
i|o[ncols][type][w][+l|b]. Select native binary input (using
binary="i") or output (usingbinary="o"), where ncols is the number of data columns of type, which must be one of:c - int8_t (1-byte signed char)
u - uint8_t (1-byte unsigned char)
h - int16_t (2-byte signed int)
H - uint16_t (2-byte unsigned int)
i - int32_t (4-byte signed int)
I - uint32_t (4-byte unsigned int)
l - int64_t (8-byte signed int)
L - uint64_t (8-byte unsigned int)
f - 4-byte single-precision float
d - 8-byte double-precision float
x - use to skip ncols anywhere in the record
For records with mixed types, append additional comma-separated combinations of ncols type (no space). The following modifiers are supported:
w after any item to force byte-swapping.
+l|b to indicate that the entire data file should be read as little- or big-endian, respectively.
Full documentation is at https://docs.generic-mapping-tools.org/latest/gmt.html#bi-full.
nodata (str) – i|onodata. Substitute specific values with NaN (for tabular data). For example,
nodata="-9999"will replace all values equal to -9999 with NaN during input and all NaN values with -9999 during output. Prepend i to the nodata value for input columns only. Prepend o to the nodata value for output columns only.find (str) – [~]“pattern” | [~]/regexp/[i]. Only pass records that match the given pattern or regular expressions [Default processes all records]. Prepend ~ to the pattern or regexp to instead only pass data expressions that do not match the pattern. Append i for case insensitive matching. This does not apply to headers or segment headers.
coltypes (str) – [i|o]colinfo. Specify data types of input and/or output columns (time or geographical data). Full documentation is at https://docs.generic-mapping-tools.org/latest/gmt.html#f-full.
x|y|z|d|X|Y|Dgap[u][+a][+ccol][+n|p]. Examine the spacing between consecutive data points in order to impose breaks in the line. To specify multiple criteria, provide a list with each item containing a string describing one set of criteria.
x|X - define a gap when there is a large enough change in the x coordinates (upper case to use projected coordinates).
y|Y - define a gap when there is a large enough change in the y coordinates (upper case to use projected coordinates).
d|D - define a gap when there is a large enough distance between coordinates (upper case to use projected coordinates).
z - define a gap when there is a large enough change in the z data. Use +ccol to change the z data column [Default col is 2 (i.e., 3rd column)].
A unit u may be appended to the specified gap:
For geographic data (x|y|d), the unit may be arc- d(egrees), m(inutes), and s(econds) , or (m)e(ters), f(eet), k(ilometers), M(iles), or n(autical miles) [Default is (m)e(ters)].
For projected data (X|Y|D), the unit may be i(nches), c(entimeters), or p(oints).
Append modifier +a to specify that all the criteria must be met [default imposes breaks if any one criterion is met].
One of the following modifiers can be appended:
+n - specify that the previous value minus the current column value must exceed gap for a break to be imposed.
+p - specify that the current value minus the previous value must exceed gap for a break to be imposed.
header (str) –
[i|o][n][+c][+d][+msegheader][+rremark][+ttitle]. Specify that input and/or output file(s) have n header records [Default is 0]. Prepend i if only the primary input should have header records. Prepend o to control the writing of header records, with the following modifiers supported:
+d to remove existing header records.
+c to add a header comment with column names to the output [Default is no column names].
+m to add a segment header segheader to the output after the header block [Default is no segment header].
+r to add a remark comment to the output [Default is no comment]. The remark string may contain \n to indicate line-breaks.
+t to add a title comment to the output [Default is no title]. The title string may contain \n to indicate line-breaks.
Blank lines and lines starting with # are always skipped.
incols (str or 1-D array) –
Specify data columns for primary input in arbitrary order. Columns can be repeated and columns not listed will be skipped [Default reads all columns in order, starting with the first (i.e., column 0)].
For 1-D array: specify individual columns in input order (e.g.,
incols=[1,0]for the 2nd column followed by the 1st column).For
str: specify individual columns or column ranges in the format start[:inc]:stop, where inc defaults to 1 if not specified, with columns and/or column ranges separated by commas (e.g.,incols="0:2,4+l"to input the first three columns followed by the log-transformed 5th column). To read from a given column until the end of the record, leave off stop when specifying the column range. To read trailing text, add the column t. Append the word number to t to ingest only a single word from the trailing text. Instead of specifying columns, useincols="n"to simply read numerical input and skip trailing text. Optionally, append one of the following modifiers to any column or column range to transform the input columns:+l to take the log10 of the input values.
+d to divide the input values by the factor divisor [Default is 1].
+s to multiple the input values by the factor scale [Default is 1].
+o to add the given offset to the input values [Default is 0].
registration (str) – g|p. Force gridline (g) or pixel (p) node registration. [Default is g(ridline)].
wrap (str) –
y|a|w|d|h|m|s|cperiod[/phase][+ccol]. Convert the input x-coordinate to a cyclical coordinate, or a different column if selected via +ccol. The following cyclical coordinate transformations are supported:
y - yearly cycle (normalized)
a - annual cycle (monthly)
w - weekly cycle (day)
d - daily cycle (hour)
h - hourly cycle (minute)
m - minute cycle (second)
s - second cycle (second)
c - custom cycle (normalized)
Full documentation is at https://docs.generic-mapping-tools.org/latest/gmt.html#w-full.
- Returns
ret (xarray.DataArray or None) – Return type depends on whether the
outgridparameter is set:xarray.DataArray: ifoutgridis not setNone if
outgridis set (grid output will be stored in file set byoutgrid)
Example
>>> import pygmt
>>> # Load a sample dataset of bathymetric x, y, and z values
>>> data = pygmt.datasets.load_sample_data(name="bathymetry")
>>> # Create a new grid with 5 arc-minutes spacing in the designated region
>>> # Set search_radius to only consider points within 10 arc-minutes of a node
>>> output = pygmt.nearneighbor(
...     data=data,
...     spacing="5m",
...     region=[245, 255, 20, 30],
...     search_radius="10m",
... )