pygmt.Figure.meca
- Figure.meca(spec, scale, convention=None, component='full', longitude=None, latitude=None, depth=None, plot_longitude=None, plot_latitude=None, event_name=None, *, offset=None, frame=None, cmap=None, extensionfill=None, compressionfill=None, projection=None, no_clip=None, region=None, verbose=None, pen=None, panel=None, perspective=None, transparency=None, **kwargs)
Plot focal mechanisms.
Full option list at https://docs.generic-mapping-tools.org/latest/supplements/seis/meca.html
Aliases:
A = offset
B = frame
C = cmap
E = extensionfill
G = compressionfill
J = projection
N = no_clip
R = region
V = verbose
W = pen
c = panel
p = perspective
t = transparency
- Parameters
spec (str, 1-D array, 2-D array, dict, or pd.DataFrame) –
Data that contains focal mechanism parameters.
speccan be specified in either of the following types:str: a file name containing focal mechanism parameters as columns. The meaning of each column is:
Columns 1 and 2: event longitude and latitude
Column 3: event depth (in km)
Columns 4 to 3+n: focal mechanism parameters. The number of columns n depends on the choice of
convection, which will be described below.Columns 4+n and 5+n: longitude, latitude at which to place beachball. Using
0 0will plot the beachball at the longitude, latitude given in columns 1 and 2. [optional and requiresoffset=Trueto take effect].Text string to appear near the beachball [optional].
1-D array: focal mechanism parameters of a single event. The meanings of columns are the same as above.
2-D array: focal mechanim parameters of multiple events. The meanings of columns are the same as above.
dictionary or pd.DataFrame: The dictionary keys or pd.DataFrame column names determine the focal mechanims convention. For different conventions, the following combination of keys are allowed:
"aki": strike, dip, rake, magnitude"gcmt": strike1, dip1, rake1, strike2, dip2, rake2, mantissa, exponent"mt": mrr, mtt, mff, mrt, mrf, mtf, exponent"partial": strike1, dip1, strike2, fault_type, magnitude"principal_axis": t_value, t_azimuth, t_plunge, n_value, n_azimuth, n_plunge, p_value, p_azimuth, p_plunge, exponent
A dictionary may contain values for a single focal mechanism or lists of values for multiple focal mechanisms.
Both dictionary and pd.DataFrame may optionally contain keys/column names:
latitude,longitude,depth,plot_longitude,plot_latitude, and/orevent_name.If
specis either a str, a 1-D array or a 2-D array, theconventionparameter is required so we know how to interpret the columns. Ifspecis a dictionary or a pd.DataFrame,conventionis not needed and is ignored if specified.
scale (str) – Adjust the scaling of the radius of the beachball, which is proportional to the magnitude. scale defines the size for magnitude = 5 (i.e. scalar seismic moment M0 = 4.0E23 dynes-cm).
convention (str) –
Focal mechanism convention. Choose from:
"aki"(Aki & Richards)"gcmt"(global CMT)"mt"(seismic moment tensor)"partial"(partial focal mechanism)"principal_axis"(principal axis)
Ignored if
specis a dictionary or pd.DataFrame.component (str) –
The component of the seismic moment tensor to plot.
"full": the full seismic moment tensor"dc": the closest double couple defined from the moment tensor (zero trace and zero determinant)"deviatoric": deviatoric part of the moment tensor (zero trace)
longitude (int, float, list, or 1-D numpy array) – Longitude(s) of event location(s). Must be the same length as the number of events. Will override the
longitudevalues inspecifspecis a dictionary or pd.DataFrame.latitude (int, float, list, or 1-D numpy array) – Latitude(s) of event location(s). Must be the same length as the number of events. Will override the
latitudevalues inspecifspecis a dictionary or pd.DataFrame.depth (int, float, list, or 1-D numpy array) – Depth(s) of event location(s) in kilometers. Must be the same length as the number of events. Will override the
depthvalues inspecifspecis a dictionary or pd.DataFrame.plot_longitude (int, float, str, list, or 1-D numpy array) – Longitude(s) at which to place beachball(s). Must be the same length as the number of events. Will override the
plot_longitudevalues inspecifspecis a dictionary or pd.DataFrame.plot_latitude (int, float, str, list, or 1-D numpy array) – Latitude(s) at which to place beachball(s). List must be the same length as the number of events. Will override the
plot_latitudevalues inspecifspecis a dictionary or pd.DataFrame.event_name (str or list of str, or 1-D numpy array) – Text string(s), e.g., event name(s) to appear near the beachball(s). List must be the same length as the number of events. Will override the
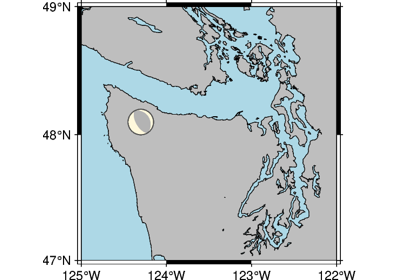
event_namevalues inspecifspecis a dictionary or pd.DataFrame.offset (bool or str) – [+ppen][+ssize]. Offset beachball(s) to longitude(s) and latitude(s) specified in the the last two columns of the input file or array, or by
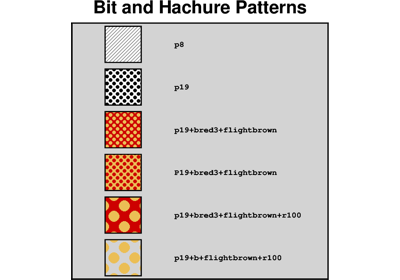
plot_longitudeandplot_latitudeif provided. A small circle is plotted at the initial location and a line connects the beachball to the circle. Use +ssize to set the diameter of the circle [Default is no circle]. Use +ppen to set the line pen attributes [Default is"0.25p"].compressionfill (str) – Set color or pattern for filling compressive quadrants [Default is
"black"].extensionfill (str) – Set color or pattern for filling extensive quadrants [Default is
"white"].pen (str) – Set pen attributes for outline of beachball [Default is
"0.25p,black,solid"].cmap (str) – File name of a CPT file or a series of comma-separated colors (e.g., color1,color2,color3) to build a linear continuous CPT from those colors automatically. The color of the compressive quadrants is determined by the z-value (i.e., event depth or the third column for an input file).
no_clip (bool) – Do not skip symbols that fall outside the frame boundaries [Default is
False, i.e., plot symbols inside the frame boundaries only].projection (str) – projcode[projparams/]width. Select map projection.
region (str or list) – xmin/xmax/ymin/ymax[+r][+uunit]. Specify the region of interest.
frame (bool or str or list) – Set map boundary frame and axes attributes.
Select verbosity level [Default is w], which modulates the messages written to stderr. Choose among 7 levels of verbosity:
q - Quiet, not even fatal error messages are produced
e - Error messages only
w - Warnings [Default]
t - Timings (report runtimes for time-intensive algorithms)
i - Informational messages (same as
verbose=True)c - Compatibility warnings
d - Debugging messages
panel (bool or int or list) – [row,col|index]. Select a specific subplot panel. Only allowed when in subplot mode. Use
panel=Trueto advance to the next panel in the selected order. Instead of row,col you may also give a scalar value index which depends on the order you set viaautolabelwhen the subplot was defined. Note: row, col, and index all start at 0.perspective (list or str) – [x|y|z]azim[/elev[/zlevel]][+wlon0/lat0[/z0]][+vx0/y0]. Select perspective view and set the azimuth and elevation angle of the viewpoint [Default is
[180, 90]]. Full documentation is at https://docs.generic-mapping-tools.org/latest/gmt.html#perspective-full.transparency (int or float) – Set transparency level, in [0-100] percent range [Default is
0, i.e., opaque]. Only visible when PDF or raster format output is selected. Only the PNG format selection adds a transparency layer in the image (for further processing).