Note
Go to the end to download the full example code.
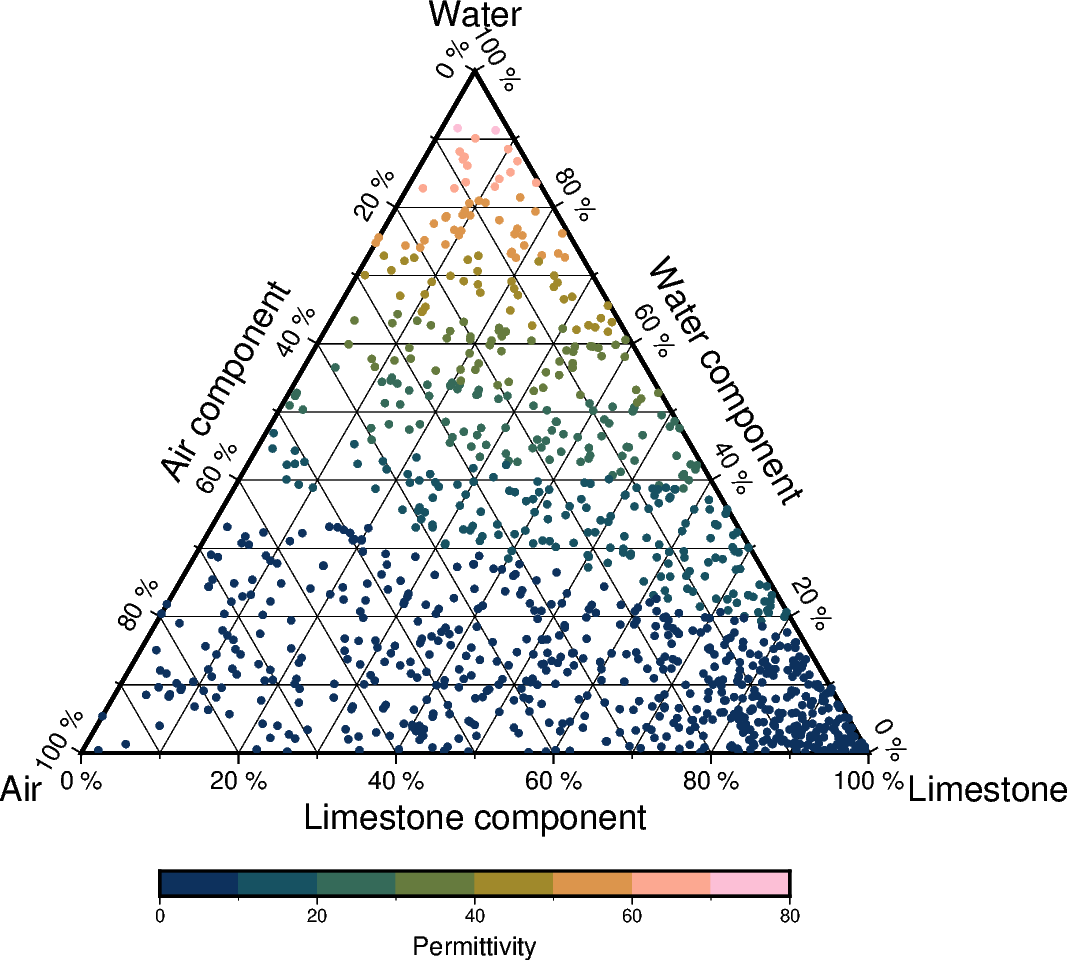
Ternary diagram
The pygmt.Figure.ternary method can draw ternary diagrams. The example
shows how to plot circles with a diameter of 0.1 centimeters
(style="c0.1c") on a 10-centimeters-wide (width="10c") ternary diagram
at the positions listed in the first three columns of the sample dataset
rock_compositions, with default annotations and gridline spacings, using
the specified labeling defined via alabel, blabel, and clabel.
Points are colored based on the values given in the fourth column of the
sample dataset via cmap=True.
import pygmt
from pygmt.params import Position

fig = pygmt.Figure()

# Load sample data
data = pygmt.datasets.load_sample_data(name="rock_compositions")

# Define a colormap to be used for the values given in the fourth column
# of the input dataset
pygmt.makecpt(cmap="SCM/batlow", series=[0, 80, 10])

fig.ternary(
    data,
    region=[0, 100, 0, 100, 0, 100],
    width="10c",
    style="c0.1c",
    alabel="Limestone",
    blabel="Water",
    clabel="Air",
    cmap=True,
    frame=[
        "aafg+lLimestone component+u %",
        "bafg+lWater component+u %",
        "cafg+lAir component+u %",
    ],
)

# Add a colorbar indicating the values given in the fourth column of the input dataset
fig.colorbar(
    position=Position("BC", cstype="outside", offset=(0, 1.5)), frame="x+lPermittivity"
)
fig.show()
Total running time of the script: (0 minutes 0.206 seconds)