Getting Started
User Guide
Panel
Reference Documentation
Development
Getting help and contributing
These examples teach us how to complete various tasks using PyGMT!
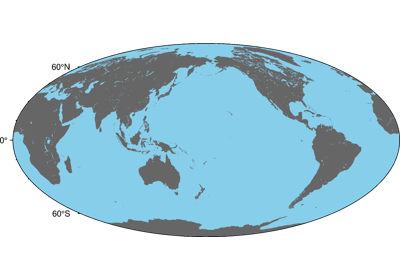
Coastlines and borders
Frames, ticks, titles, and labels
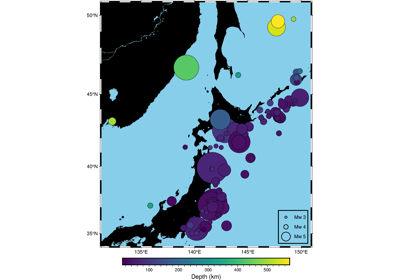
Plotting data points
Plotting lines
Plotting polygons
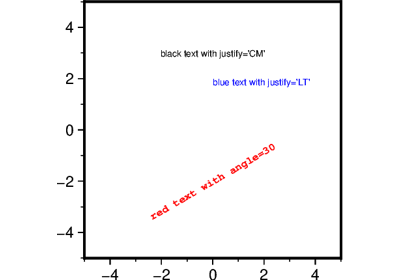
Plotting text
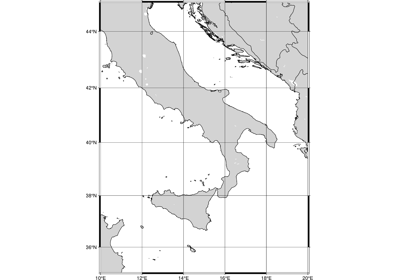
Setting the region
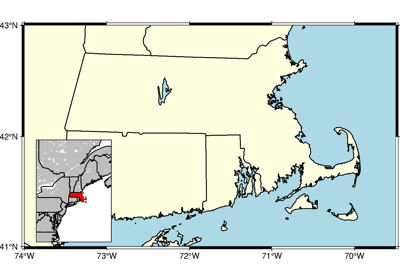
Adding an inset to the figure
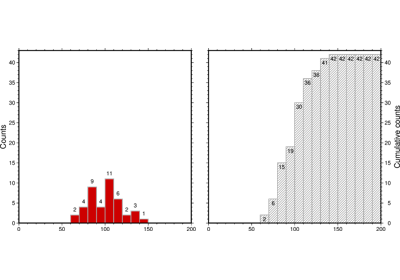
Cartesian histograms
Configuring PyGMT defaults
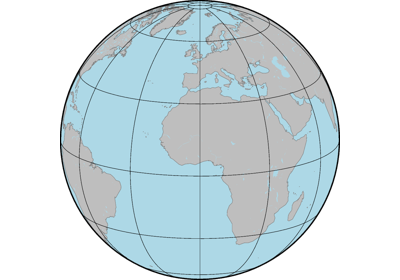
Creating a 3-D perspective image
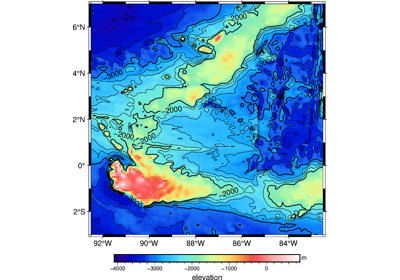
Creating a map with contour lines
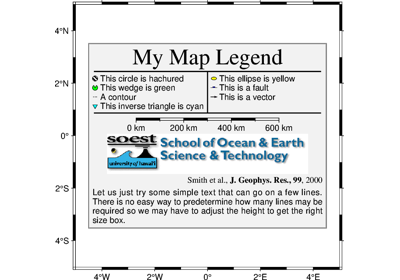
Creating legends
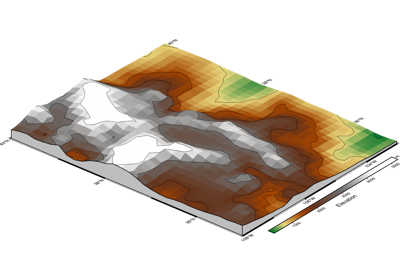
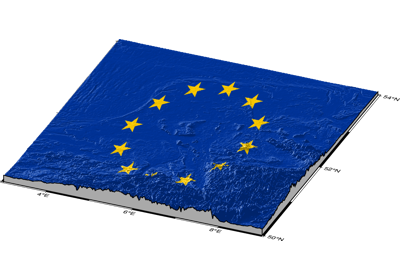
Draping a dataset on top of a topographic surface
Interactive data visualization using Panel
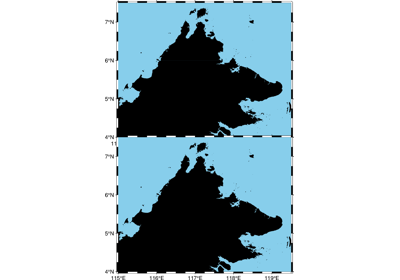
Making subplots
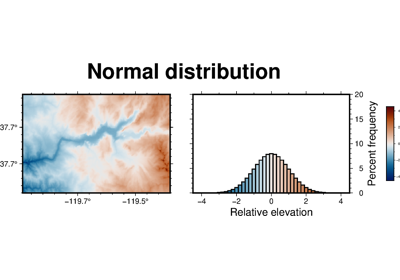
Performing grid histogram equalization
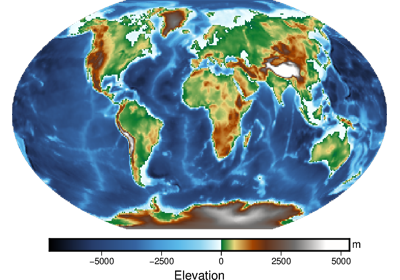
Plotting Earth relief
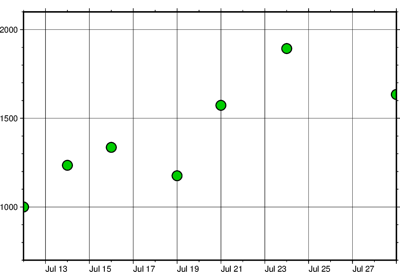
Plotting datetime charts
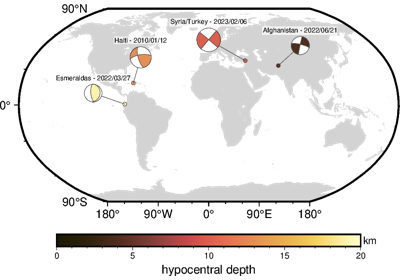
Plotting focal mechanisms
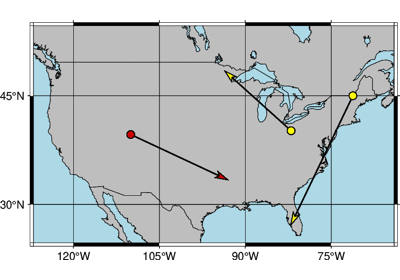
Plotting vectors
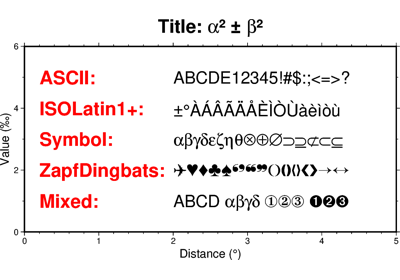
Typesetting non-ASCII text
Gallery generated by Sphinx-Gallery