Note
Go to the end to download the full example code.
Highlight country, continent and state polygons
The pygmt.Figure.coast method can highlight country polygons via the dcw
parameter. It accepts the country code (following the 2-letter
ISO 3166-1 alpha-2 convention) or
full country name and can draw its borders and add a color to its landmass. It’s also
possible to define multiple countries at once by separating the individual names with
commas.
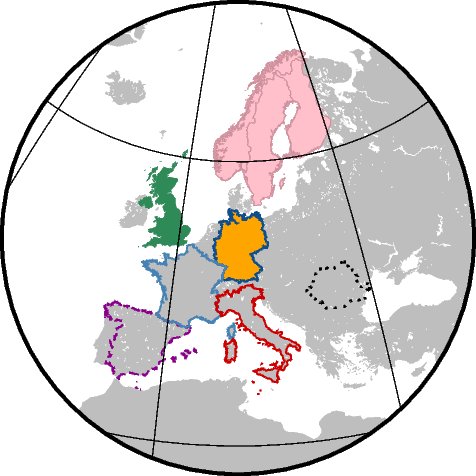
import pygmt

fig = pygmt.Figure()

fig.coast(
    region=[-12, 32, 34, 72],
    # Lambert Azimuthal Equal Area lon0/lat0/horizon/width
    projection="A10/52/25/6c",
    land="gray",
    water="white",
    frame="afg",
    dcw=[
        # Great Britain (country code) with seagreen land
        "GB+gseagreen",
        # Italy with a red border
        "IT+p0.5p,red3",
        # Spain with a magenta dashed border
        "ES+p0.5p,magenta4,-",
        # Romania with a black dotted border
        "RO+p0.75p,black,.",
        # Germany with orange land and a blue border
        "DE+gorange+p0.5p,dodgerblue4",
        # France (full country name) with a steelblue border
        "France+p0.5p,steelblue",
        # Norway, Sweden and Finland (multiple countries) with pink
        # land and pink3 borders
        "Norway,Sweden,Finland+gpink+p0.2p,pink3",
    ],
)

fig.show()
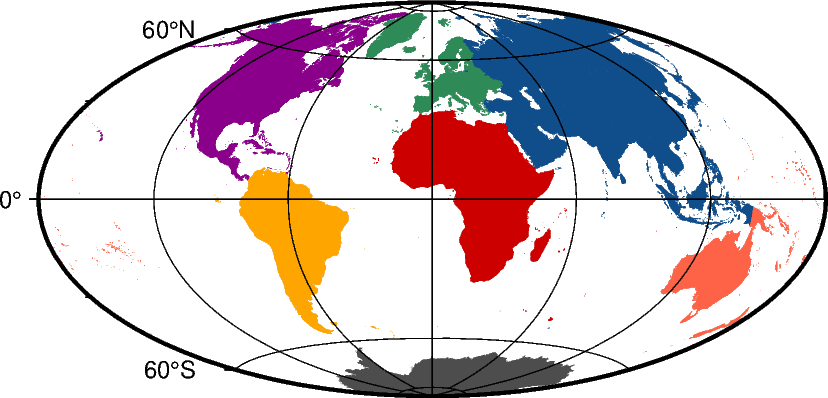
Entire continents can also be highlighted by adding "=" in
front of the continent code to differentiate it from a country code.
fig = pygmt.Figure()

fig.coast(
    region="d",
    projection="H10c",
    land="gray",
    water="white",
    frame="afg",
    dcw=[
        # Europe
        "=EU+gseagreen",
        # Africa
        "=AF+gred3",
        # North America
        "=NA+gmagenta4",
        # South America
        "=SA+gorange",
        # Asia
        "=AS+gdodgerblue4",
        # Oceania
        "=OC+gtomato",
        # Antarctica
        "=AN+ggray30",
    ],
)

fig.show()
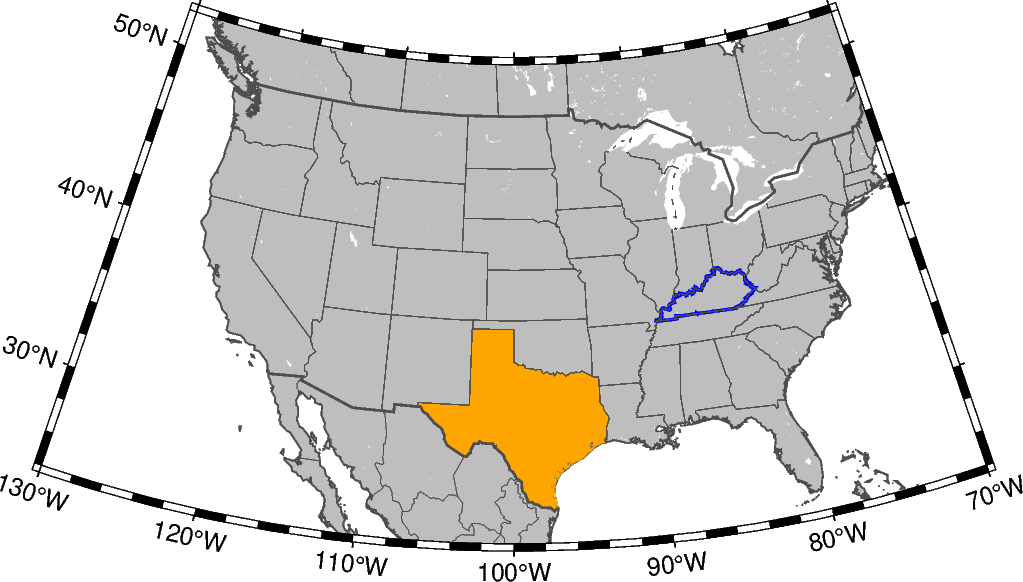
If available, states/territories of a country can be highlighted, too.
fig = pygmt.Figure()

fig.coast(
    region=[-130, -70, 24, 52],
    projection="L-100/35/33/45/12c",
    land="gray",
    shorelines="1/0.5p,gray30",
    borders=["1/0.8p,gray30", "2/0.2p,gray30"],
    frame=True,
    dcw=[
        # Texas with orange fill
        "US.TX+gorange",
        # Kentucky with blue outline
        "US.KY+p1p,blue",
    ],
)

fig.show()
Total running time of the script: (0 minutes 7.233 seconds)