Note
Click here to download the full example code
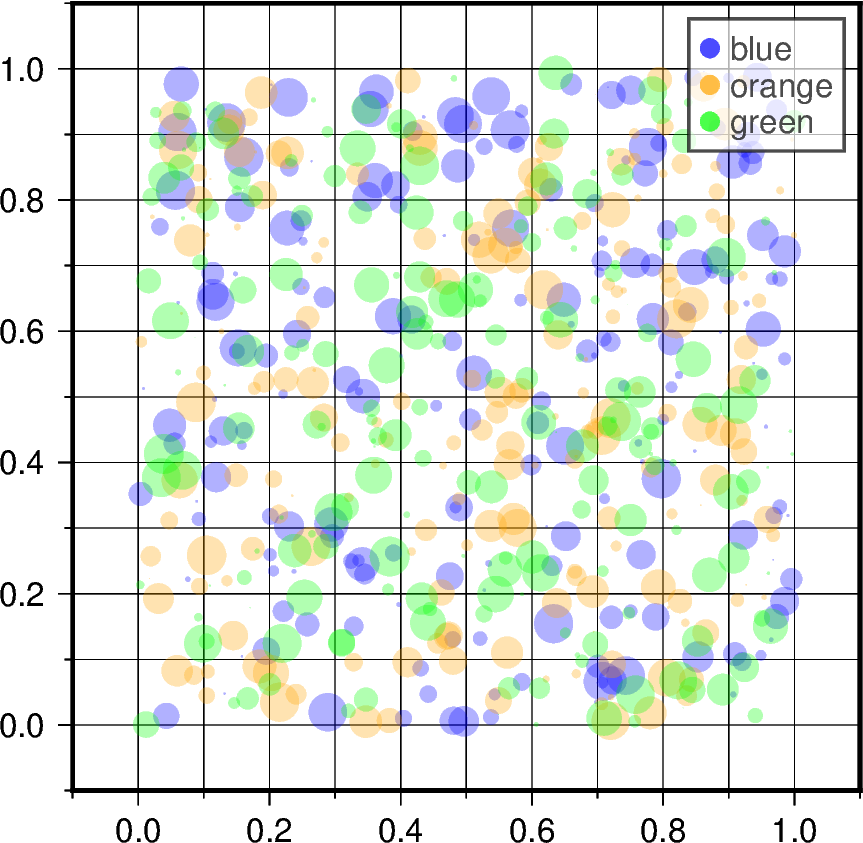
Scatter plots with a legend
To create a scatter plot with a legend one may use a loop and create one scatter plot per item to appear in the legend and set the label accordingly.
Modified from the matplotlib example: https://matplotlib.org/gallery/lines_bars_and_markers/scatter_with_legend.html
Out:
<IPython.core.display.Image object>
import numpy as np
import pygmt

np.random.seed(19680801)
n = 200  # number of random data points

fig = pygmt.Figure()
fig.basemap(
    region=[-0.1, 1.1, -0.1, 1.1],
    projection="X10c/10c",
    frame=["xa0.2fg", "ya0.2fg", "WSrt"],
)
for color in ["blue", "orange", "green"]:
    x, y = np.random.rand(2, n)  # random X and Y data in [0,1]
    sizes = np.random.rand(n) * 0.5  # random size [0,0.5], in cm
    # plot data points as circles (style="c"), with different sizes
    fig.plot(
        x=x,
        y=y,
        style="c",
        sizes=sizes,
        color=color,
        # Set the legend label,
        # and set the circle size to be 0.25 cm (+S0.25c) in legend
        label=f"{color}+S0.25c",
        transparency=70,  # set transparency level for all symbols
    )

fig.legend(transparency=30)  # set transparency level for legends
fig.show()
Total running time of the script: ( 0 minutes 0.751 seconds)