Note
Click here to download the full example code
Plotting text
It is often useful to add annotations to a map plot. This is handled by
pygmt.Figure.text.
Note
This tutorial assumes the use of a Python notebook, such as IPython or Jupyter Notebook.
To see the figures while using a Python script instead, use
fig.show(method="external") to display the figure in the default PDF viewer.
To save the figure, use fig.savefig("figname.pdf") where "figname.pdf"
is the desired name and file extension for the saved figure.
import os

import pygmt
Basic map annotation
Text annotations can be added to a map using the pygmt.Figure.text
method of the pygmt.Figure class.
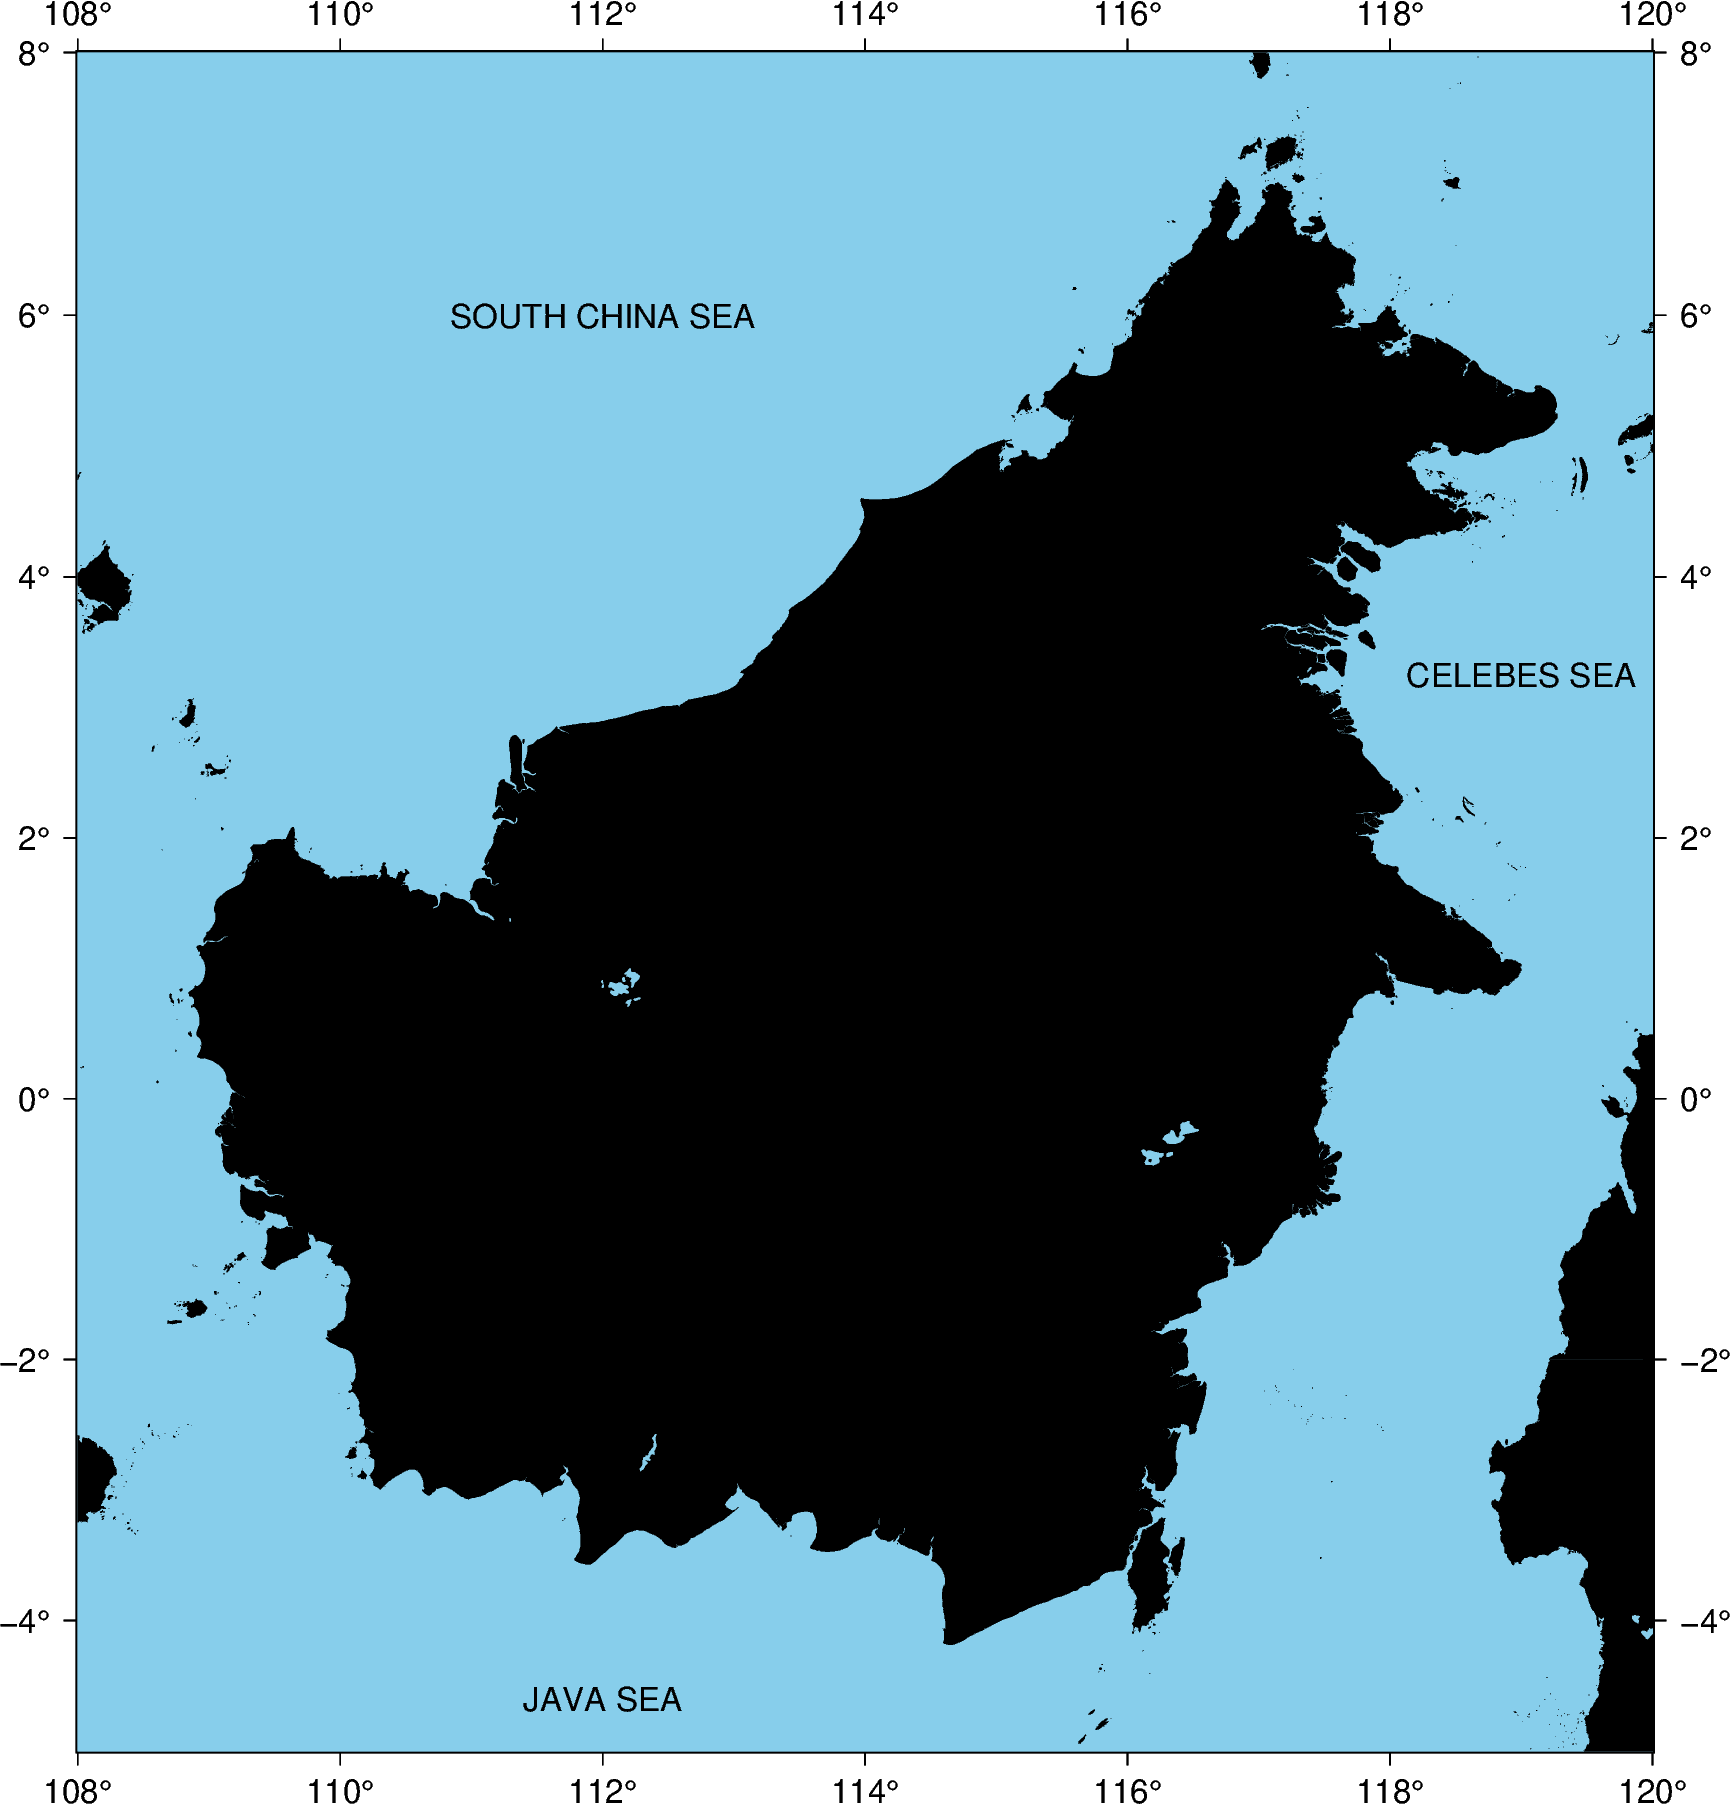
Here we create a simple map and add an annotation using the text, x,
and y parameters to specify the annotation text and position in the
projection frame. text accepts str types, while x, and y
accepts either int or float numbers, or a list/array of numbers.
fig = pygmt.Figure()
with pygmt.config(MAP_FRAME_TYPE="plain"):
    fig.basemap(region=[108, 120, -5, 8], projection="M20c", frame="a")
fig.coast(land="black", water="skyblue")

# Plot text annotations using a single element
fig.text(text="SOUTH CHINA SEA", x=112, y=6)

# Plot text annotations using lists of elements
fig.text(text=["CELEBES SEA", "JAVA SEA"], x=[119, 112], y=[3.25, -4.6])

fig.show()
Out:
<IPython.core.display.Image object>
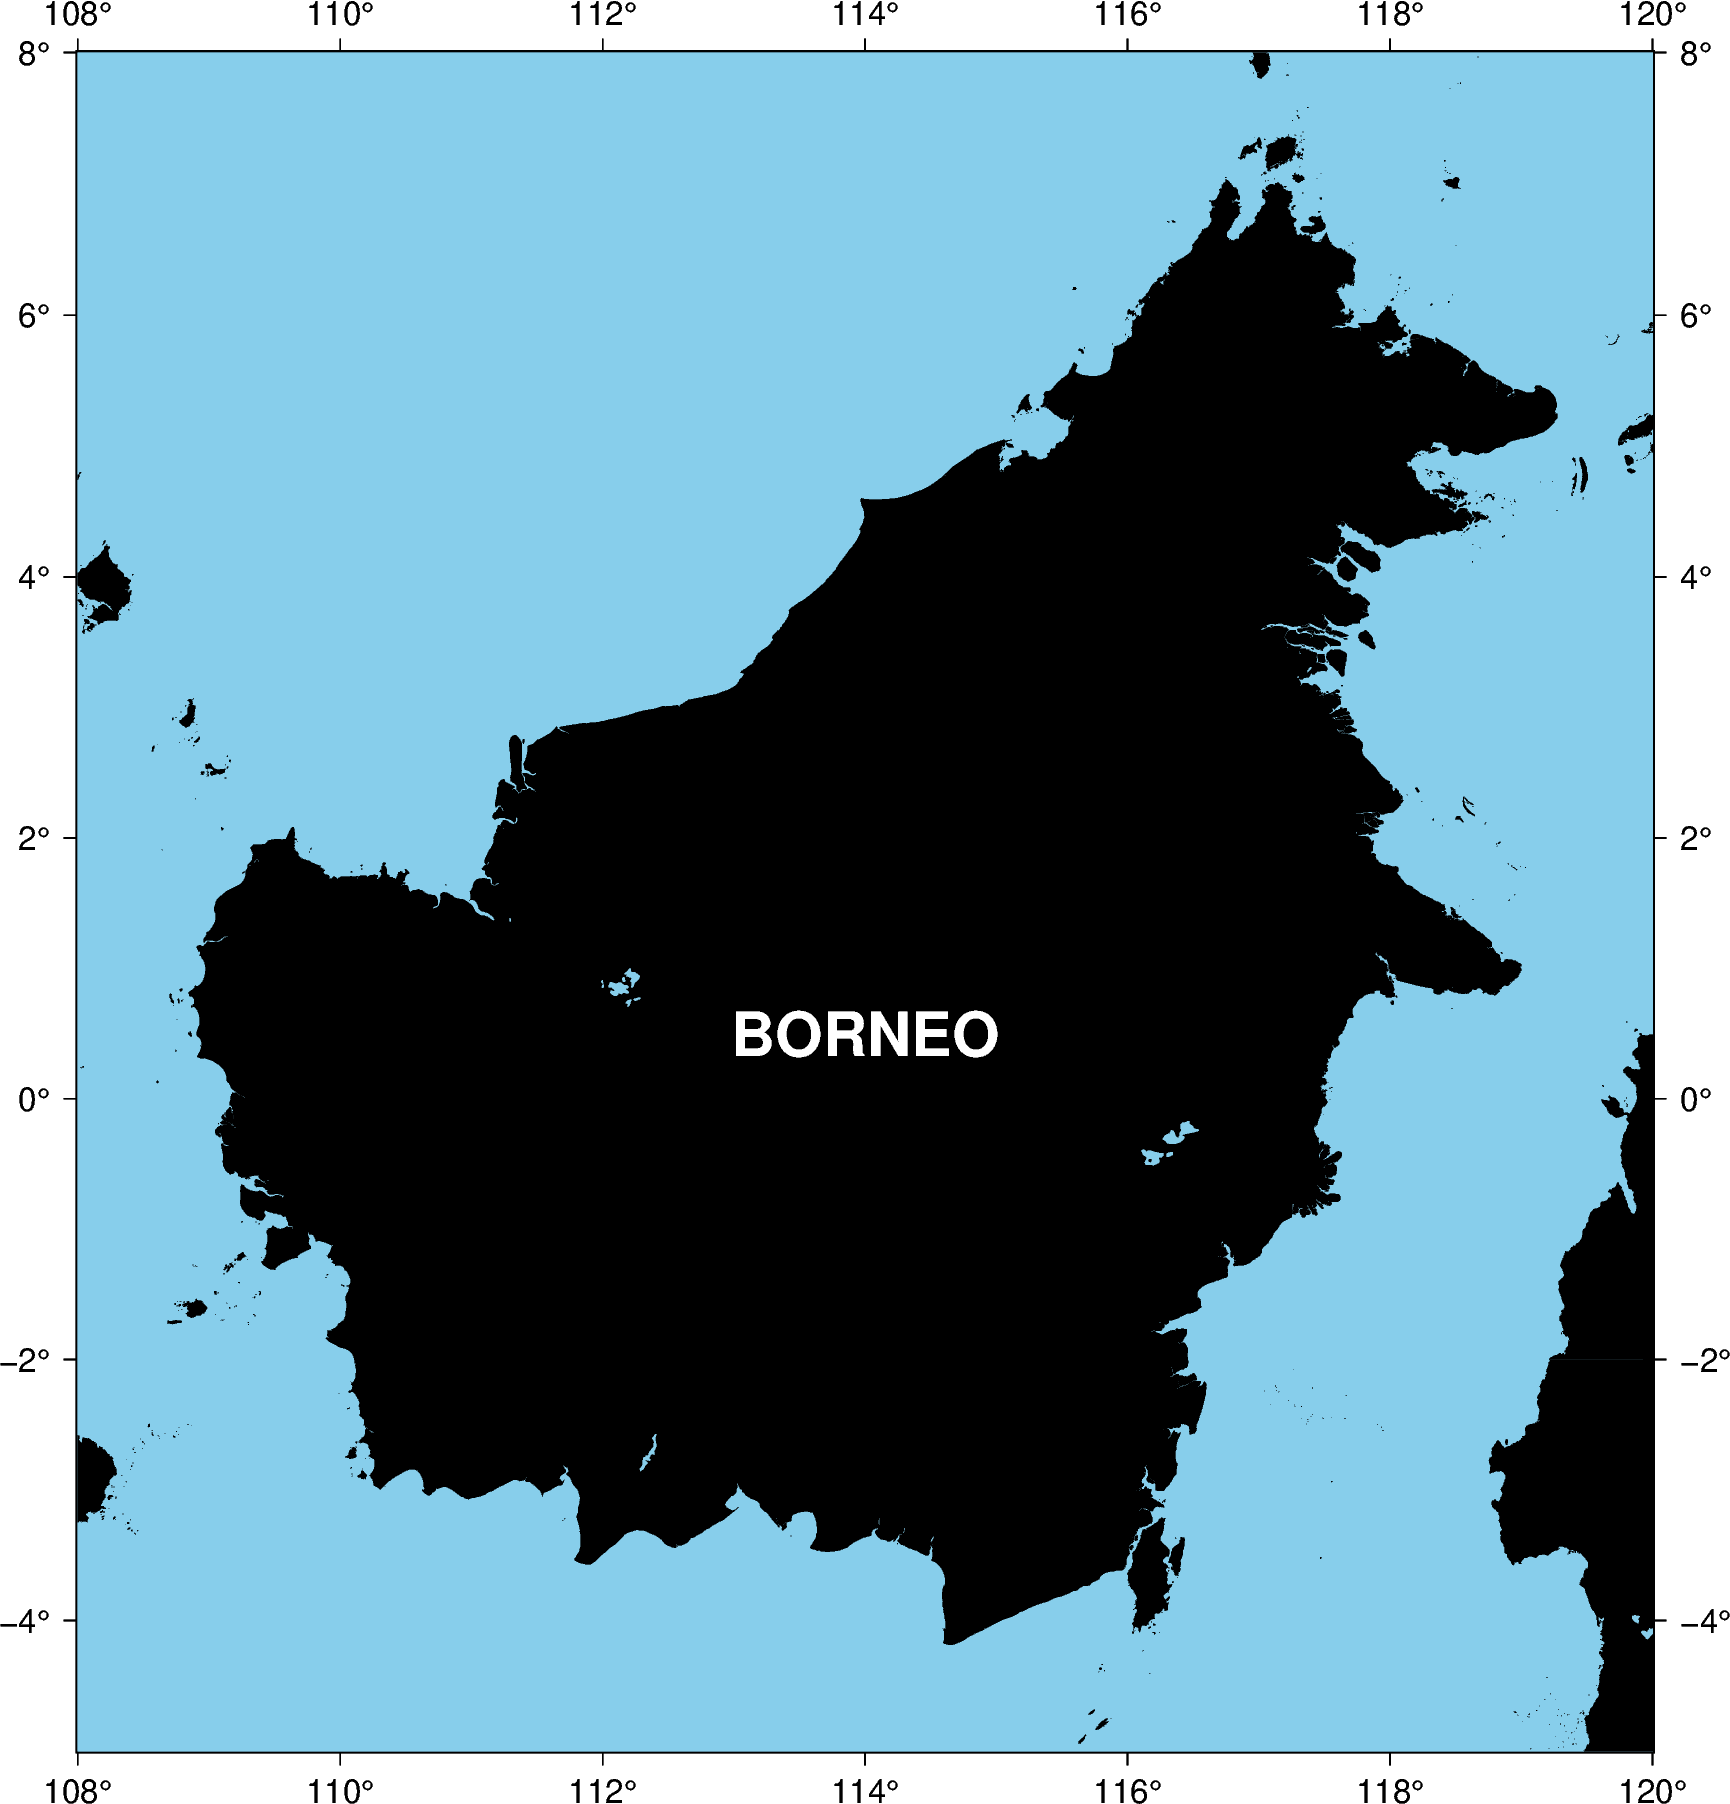
Changing font style
The size, family/weight, and color of an annotation can be specified using
the font parameter.
A list of all recognized fonts can be found at PostScript Fonts Used by GMT, including details of how to use non-default fonts.
fig = pygmt.Figure()
with pygmt.config(MAP_FRAME_TYPE="plain"):
    fig.basemap(region=[108, 120, -5, 8], projection="M20c", frame="a")
fig.coast(land="black", water="skyblue")

# Customize the font style
fig.text(text="BORNEO", x=114.0, y=0.5, font="22p,Helvetica-Bold,white")

fig.show()
Out:
<IPython.core.display.Image object>
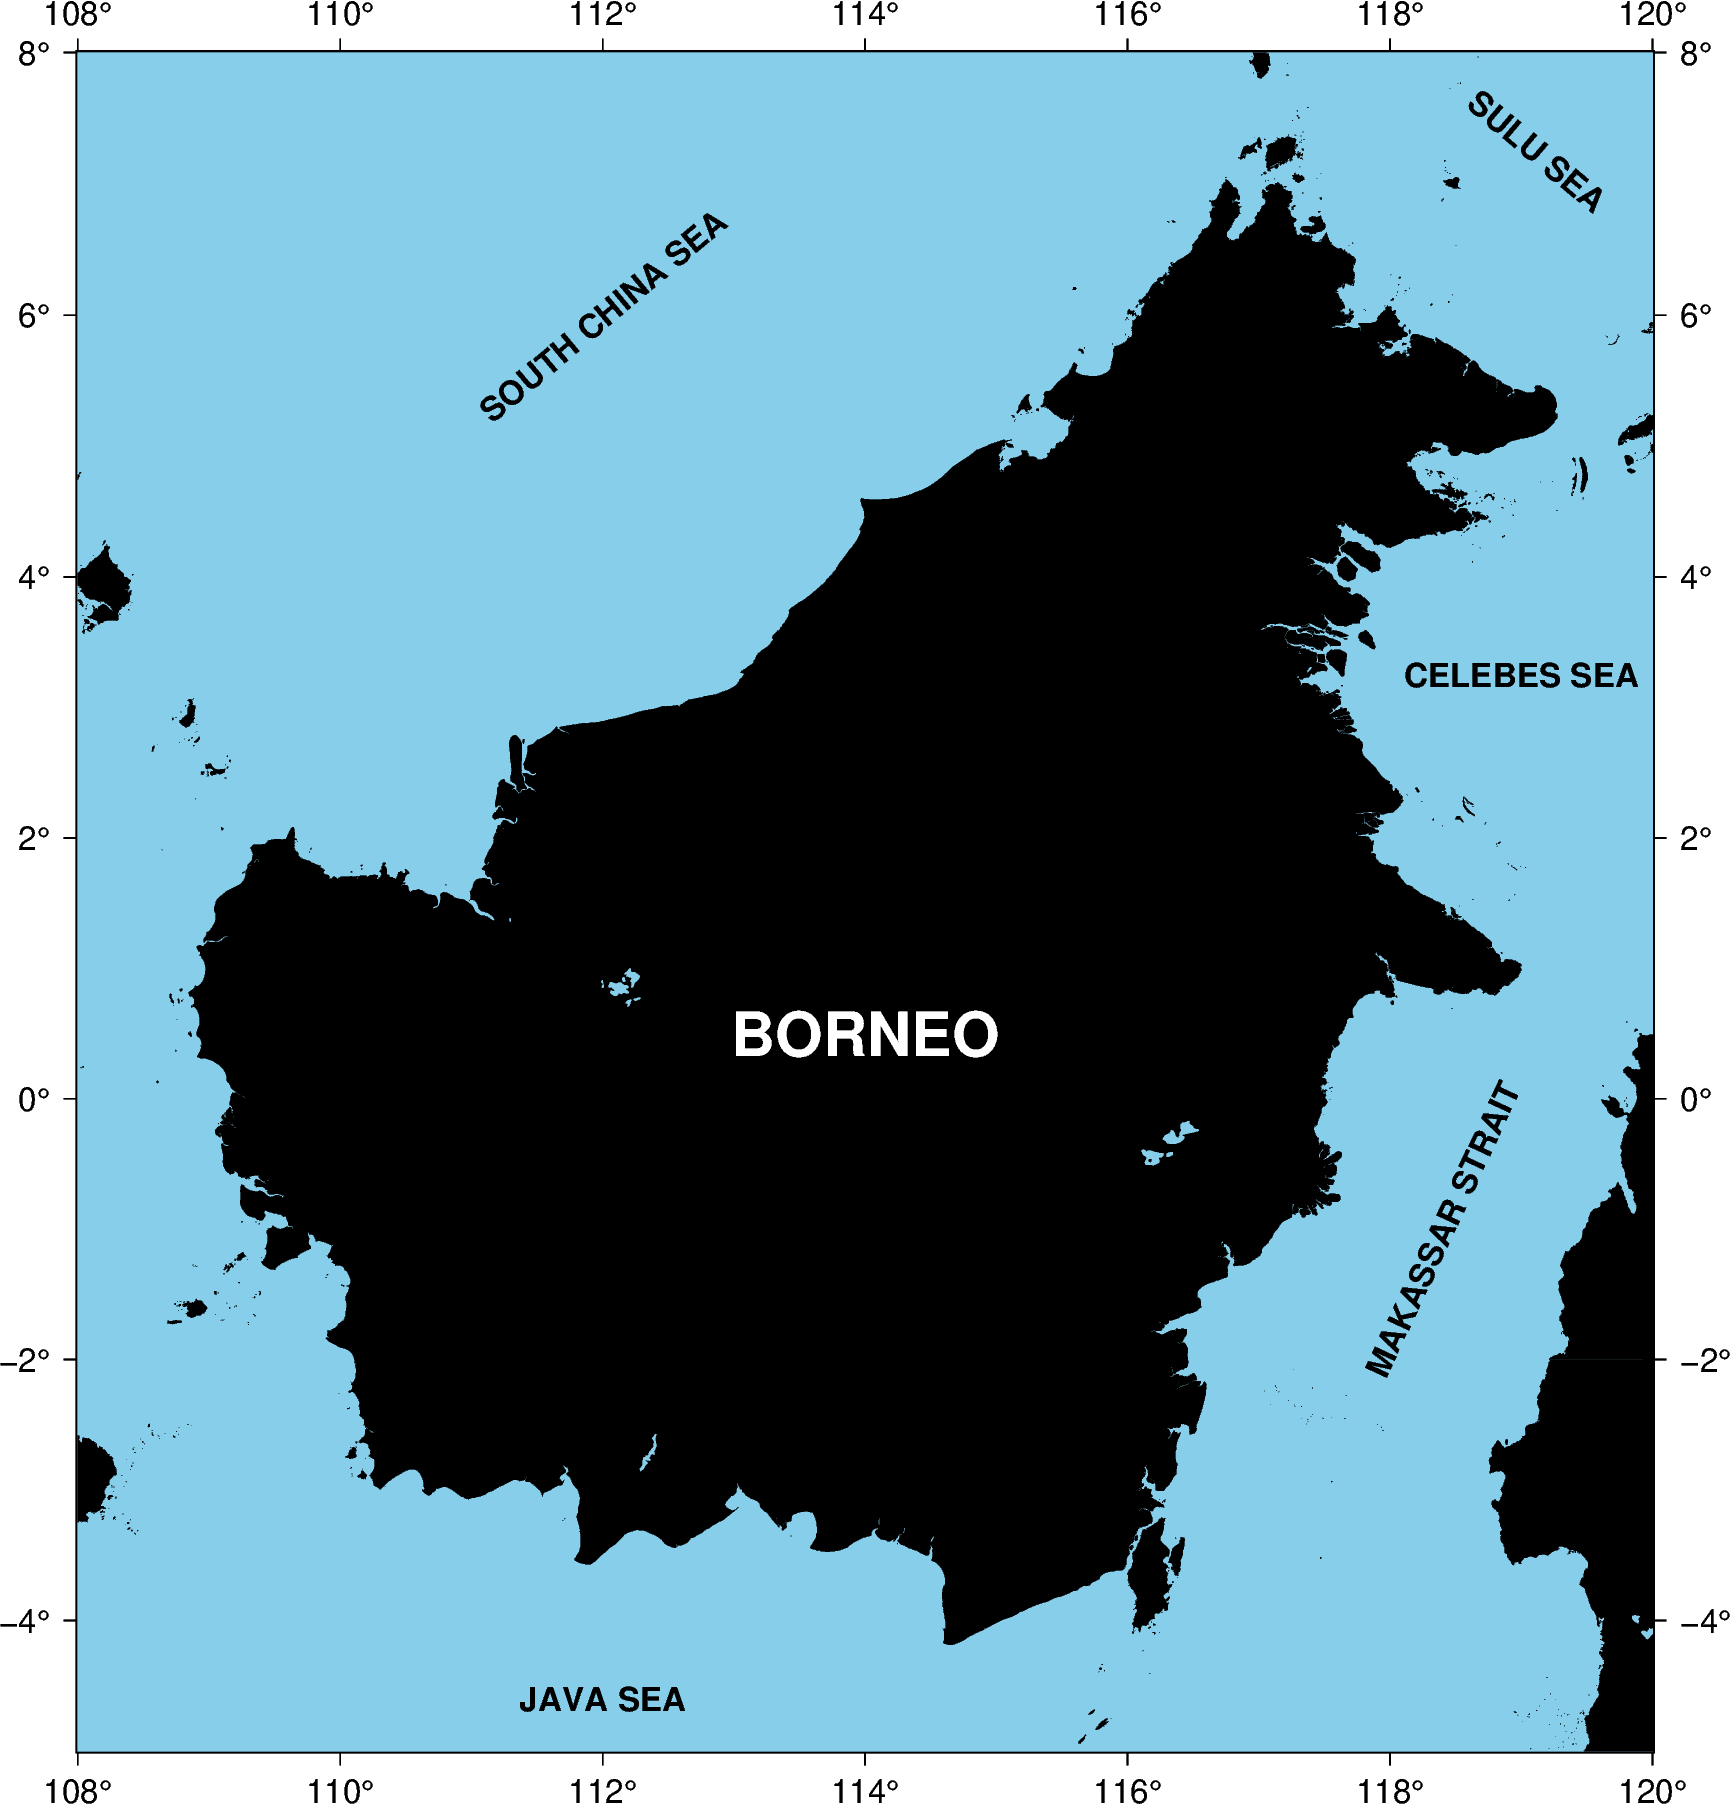
Plotting from a text file
It is also possible to add annotations from a file containing x, y, and
text fields. Here we give a complete example.
fig = pygmt.Figure()
with pygmt.config(MAP_FRAME_TYPE="plain"):
    fig.basemap(region=[108, 120, -5, 8], projection="M20c", frame="a")
fig.coast(land="black", water="skyblue")

# Create space-delimited file
with open("examples.txt", "w") as f:
    f.write("114 0.5 0 22p,Helvetica-Bold,white CM BORNEO\n")
    f.write("119 3.25 0 12p,Helvetica-Bold,black CM CELEBES SEA\n")
    f.write("112 -4.6 0 12p,Helvetica-Bold,black CM JAVA SEA\n")
    f.write("112 6 40 12p,Helvetica-Bold,black CM SOUTH CHINA SEA\n")
    f.write("119.12 7.25 -40 12p,Helvetica-Bold,black CM SULU SEA\n")
    f.write("118.4 -1 65 12p,Helvetica-Bold,black CM MAKASSAR STRAIT\n")

# Plot region names / sea names from a text file, where
# the longitude (x) and latitude (y) coordinates are in the first two columns.
# Setting angle/font/justify to True will indicate that those columns are
# present in the text file too (Note: must be in that order!).
# Finally, the text to be printed will be in the last column
fig.text(textfiles="examples.txt", angle=True, font=True, justify=True)

# Cleanups
os.remove("examples.txt")

fig.show()
Out:
<IPython.core.display.Image object>
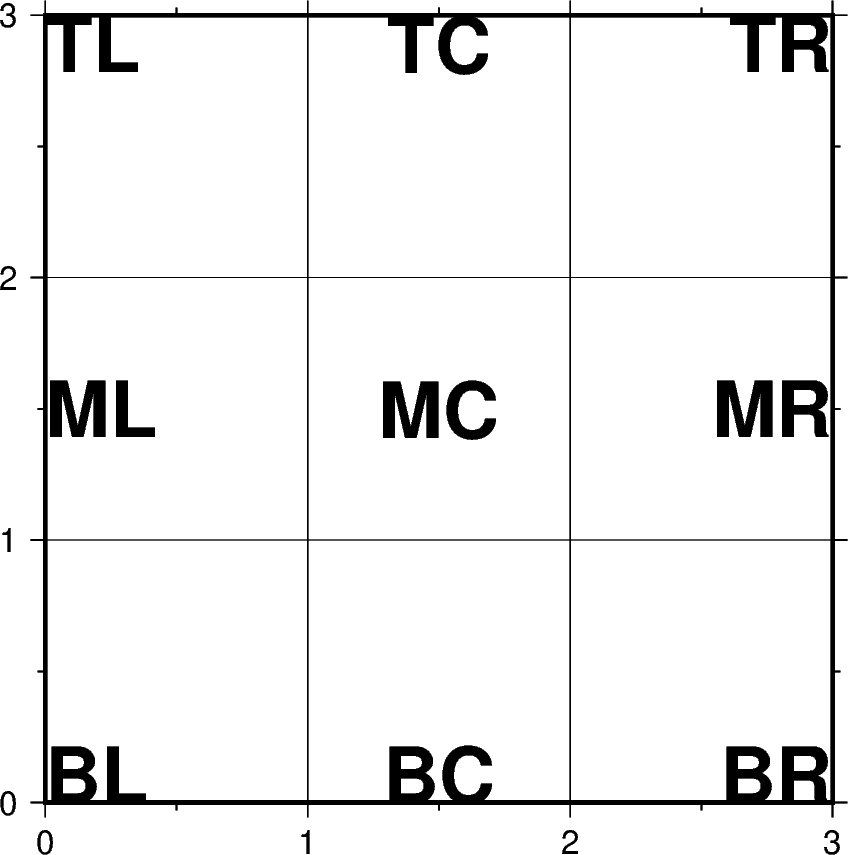
justify parameter
justify is used to define the anchor point for the bounding box for text
being added to a plot. The following code segment demonstrates the
positioning of the anchor point relative to the text.
The anchor is specified with a two letter (order independent) code, chosen from:
Vertical anchor: T(op), M(iddle), B(ottom)
Horizontal anchor: L(eft), C(entre), R(ight)
fig = pygmt.Figure()
fig.basemap(region=[0, 3, 0, 3], projection="X10c", frame=["WSne", "af0.5g"])
for position in ("TL", "TC", "TR", "ML", "MC", "MR", "BL", "BC", "BR"):
    fig.text(
        text=position,
        position=position,
        font="28p,Helvetica-Bold,black",
        justify=position,
    )
fig.show()
Out:
<IPython.core.display.Image object>
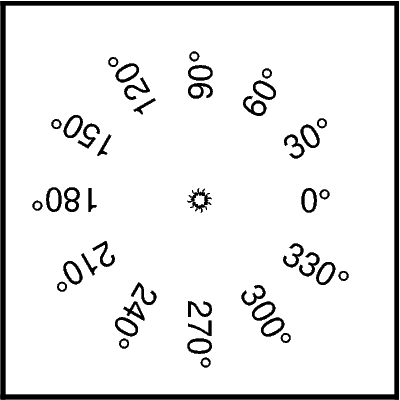
angle parameter
angle is an optional parameter used to specify the clockwise rotation of
the text from the horizontal.
fig = pygmt.Figure()
fig.basemap(region=[0, 4, 0, 4], projection="X5c", frame="WSen")
for i in range(0, 360, 30):
    fig.text(text=f"`          {i}@.", x=2, y=2, justify="LM", angle=i)
fig.show()
Out:
<IPython.core.display.Image object>
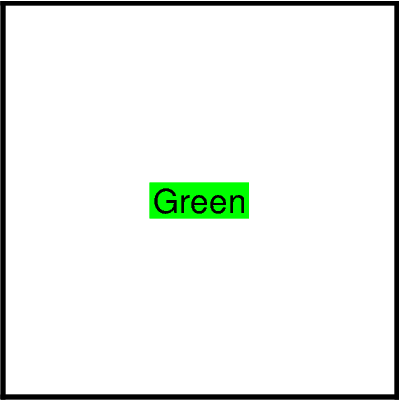
fill parameter
fill is used to set the fill color of the area surrounding the text.
fig = pygmt.Figure()
fig.basemap(region=[0, 1, 0, 1], projection="X5c", frame="WSen")
fig.text(text="Green", x=0.5, y=0.5, fill="green")
fig.show()
Out:
<IPython.core.display.Image object>
Advanced configuration
For crafting more advanced styles, be sure to check out the GMT documentation at https://docs.generic-mapping-tools.org/latest/text.html and also the cookbook at https://docs.generic-mapping-tools.org/latest/cookbook/features.html#placement-of-text. Good luck!
Total running time of the script: ( 0 minutes 13.666 seconds)