Note
Click here to download the full example code
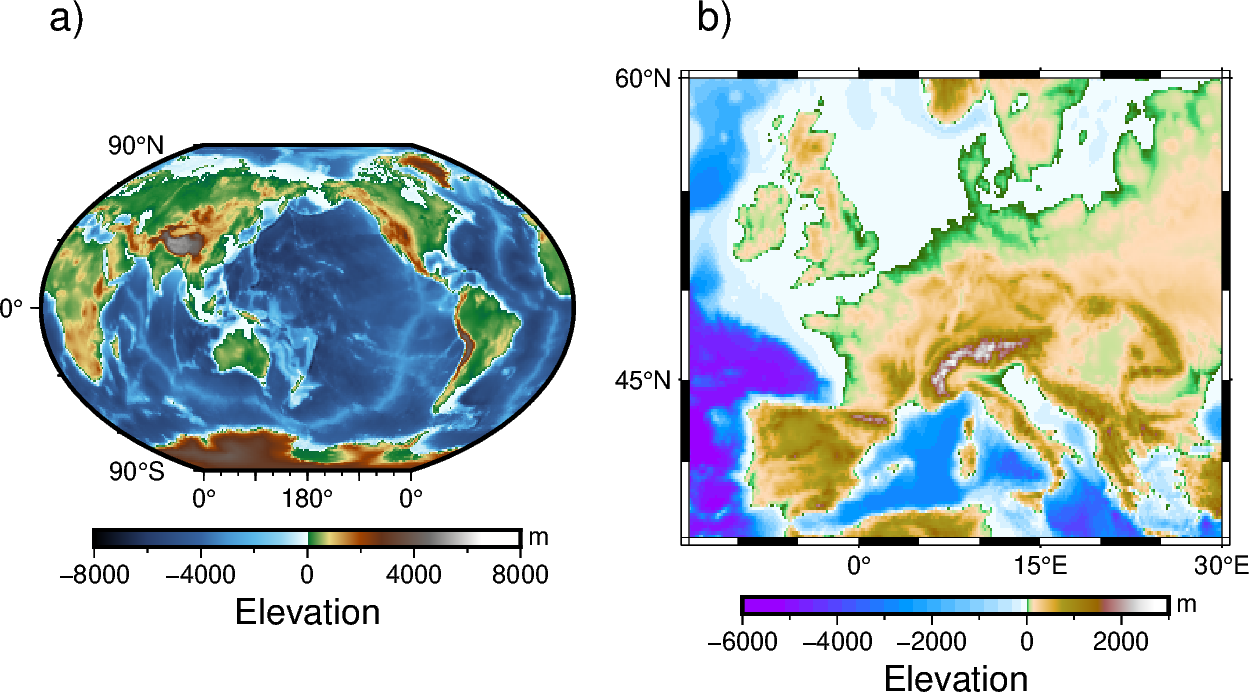
Multiple colormaps
This gallery example shows how to create multiple colormaps for different subplots. To better understand how GMT modern mode maintains several levels of colormaps, please refer to https://docs.generic-mapping-tools.org/latest/cookbook/features.html#gmt-modern-mode-hierarchical-levels for details.
Out:
grdimage [WARNING]: 2 annotations along the bottom border were skipped due to crowding.
grdimage [WARNING]: Crowding decisions is controlled by MAP_ANNOT_MIN_SPACING, currently set to 25.5563p.
grdimage [WARNING]: Decrease or increase MAP_ANNOT_MIN_SPACING to see more or fewer annotations, with 0 showing all annotations.
<IPython.core.display.Image object>
import pygmt

fig = pygmt.Figure()

# Load Earth relief data for the entire globe and a subset region
grid_globe = pygmt.datasets.load_earth_relief(resolution="01d")
subset_region = [-14, 30, 35, 60]
grid_subset = pygmt.datasets.load_earth_relief(resolution="10m", region=subset_region)

# Define a 1-row, 2-column subplot layout. The overall figure dimensions is set
# to be 15 cm wide and 8 cm high. Each subplot is automatically labelled.
# The space between the subplots is set to be 0.5 cm.
with fig.subplot(
    nrows=1, ncols=2, figsize=("15c", "8c"), autolabel=True, margins="0.5c"
):
    # Activate the first panel so that the colormap created by the makecpt
    # method is a panel-level CPT
    with fig.set_panel(panel=0):
        pygmt.makecpt(cmap="geo", series=[-8000, 8000])
        # "R?" means Winkel Tripel projection with map width automatically
        # determined from the subplot width.
        fig.grdimage(grid=grid_globe, projection="R?", region="g", frame=True)
        fig.colorbar(frame=["a4000f2000", "x+lElevation", "y+lm"])
    # Activate the second panel so that the colormap created by the makecpt
    # method is a panel-level CPT
    with fig.set_panel(panel=1):
        pygmt.makecpt(cmap="globe", series=[-6000, 3000])
        # "M?" means Mercator projection with map width also automatically
        # determined from the subplot width.
        fig.grdimage(
            grid=grid_subset, projection="M?", region=subset_region, frame=True
        )
        fig.colorbar(frame=["a2000f1000", "x+lElevation", "y+lm"])

fig.show()
Total running time of the script: ( 0 minutes 2.193 seconds)