Note
Click here to download the full example code
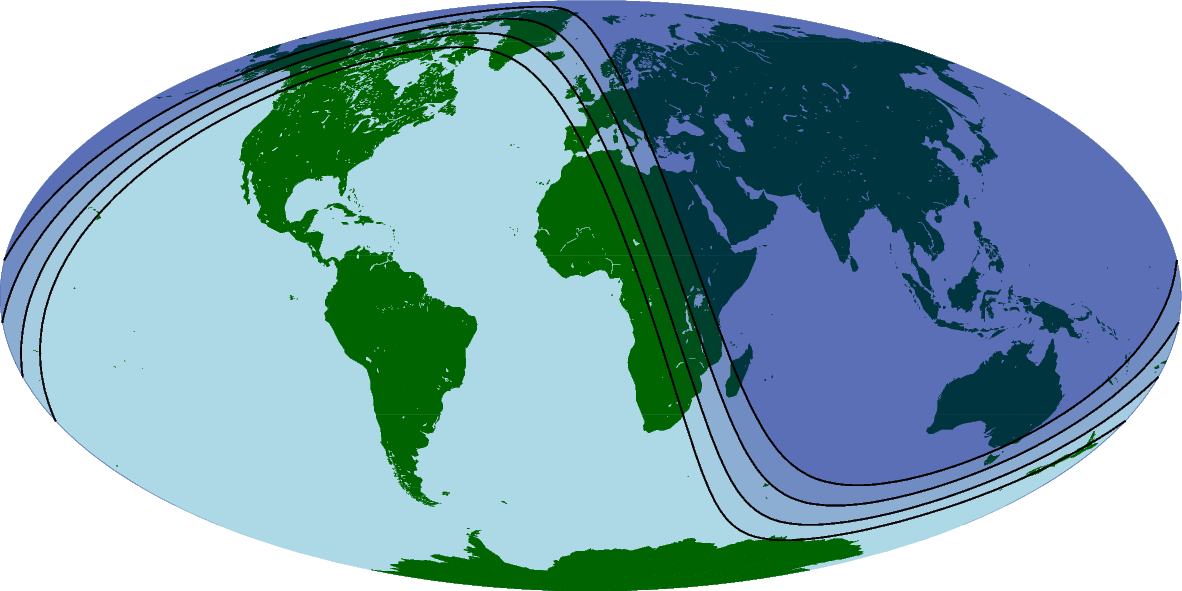
Day-night terminator line and twilights
Use pygmt.Figure.solar to show the different transition stages between daytime
and nighttime. The parameter terminator is used to set the twilight stage, and can be
either ‘day-night’ (brightest), ‘civil’, ‘nautical’, or ‘astronomical’ (darkest). Refer
to https://en.wikipedia.org/wiki/Twilight for more information.
Out:
<IPython.core.display.Image object>
import datetime

import pygmt

fig = pygmt.Figure()
# Create a figure showing the global region on a Mollweide projection
# Land color is set to dark green and water color is set to light blue
fig.coast(region="d", projection="W0/15c", land="darkgreen", water="lightblue")
# Set a time for the day-night terminator and twilights, 1700 UTC on January 1, 2000
terminator_datetime = datetime.datetime(
    year=2000, month=1, day=1, hour=17, minute=0, second=0
)
# Set the pen line to be 0.5p thick
# Set the fill for the night area to be navy blue at different transparency levels
fig.solar(
    terminator="day_night",
    terminator_datetime=terminator_datetime,
    fill="navyblue@95",
    pen="0.5p",
)
fig.solar(
    terminator="civil",
    terminator_datetime=terminator_datetime,
    fill="navyblue@85",
    pen="0.5p",
)
fig.solar(
    terminator="nautical",
    terminator_datetime=terminator_datetime,
    fill="navyblue@80",
    pen="0.5p",
)
fig.solar(
    terminator="astronomical",
    terminator_datetime=terminator_datetime,
    fill="navyblue@80",
    pen="0.5p",
)
fig.show()
Total running time of the script: ( 0 minutes 1.892 seconds)