Note
Click here to download the full example code
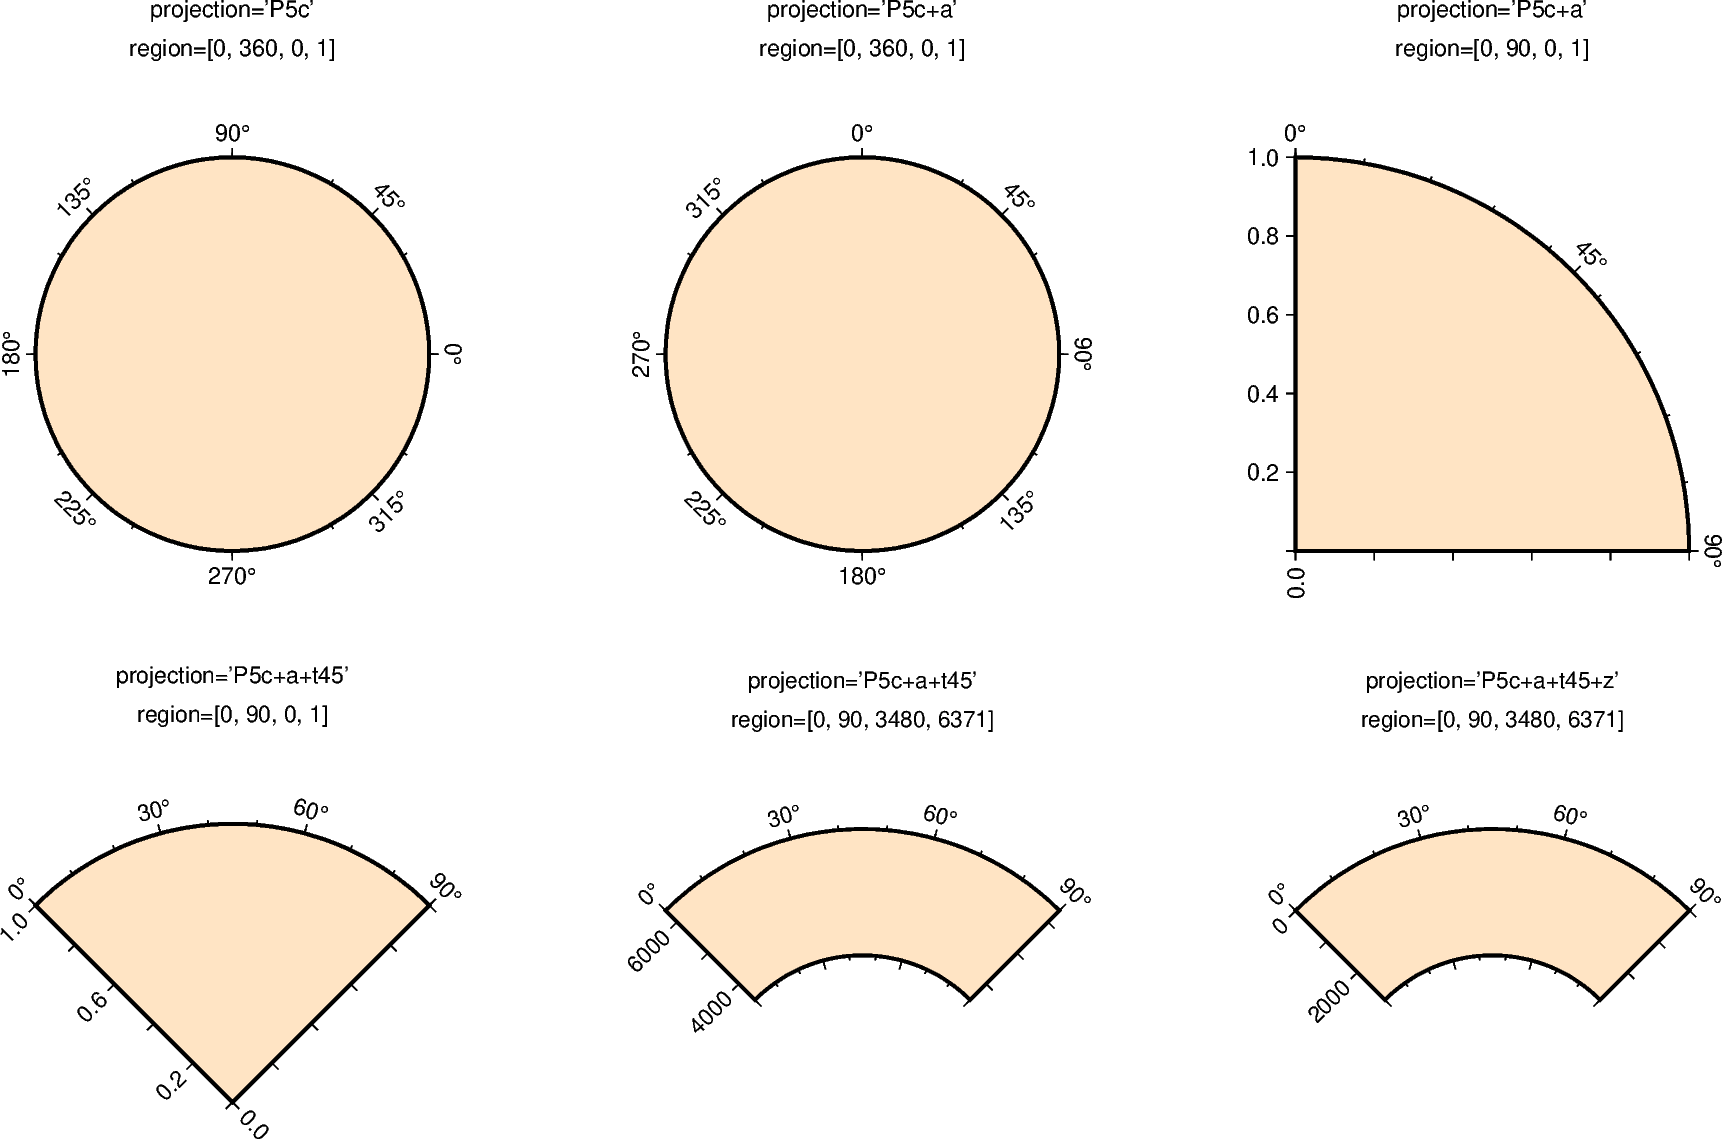
Polar
Polar projections allow plotting polar coordinate data (e.g. angle \(\theta\) and radius r).
The full syntax for polar projections is:
Pwidth[+a][+f[e|p|radius]][+roffset][+torigin][+z[p|radius]]
Limits are set via the region parameter
([theta_min, theta_max, radius_min, radius_max]). When using
Pwidth you have to give the width of the figure. The lower-case
version p is similar to P but expects a scale instead of
a width (pscale).
The following customizing modifiers are available:
+a: by default, \(\theta\) refers to the angle that is equivalent to a counterclockwise rotation with respect to the east direction (standard definition); +a indicates that the input data is rotated clockwise relative to the north direction (geographical azimuth angle).
+roffset: represents the offset of the r axis. This modifier allows you to offset the center of the circle from r=0.
+torigin: sets the angle corresponding to the east direction which is equivalent to rotating the entire coordinate axis clockwise; if the +a modifier is used, setting the angle corresponding to the north direction is equivalent to rotating the entire coordinate axis counterclockwise.
+f: reverses the radial direction.
Append e to indicate that the r-axis is an elevation angle, and the range of the r-axis should be between 0 and 90.
Appending p sets the current earth radius (determined by PROJ_ELLIPSOID) to the maximum value of the r axis when the r axis is reversed.
Append radius to set the maximum value of the r axis.
+z: indicates that the r axis is marked as depth instead of radius (e.g. r = radius - z).
Append p to set radius to the current earth radius.
Append radius to set the value of the radius.
Out:
basemap [WARNING]: 2 annotations along the right border were skipped due to crowding.
basemap [WARNING]: Crowding decisions is controlled by MAP_ANNOT_MIN_SPACING, currently set to 23.0363p.
basemap [WARNING]: Decrease or increase MAP_ANNOT_MIN_SPACING to see more or fewer annotations, with 0 showing all annotations.
basemap [WARNING]: 1 annotations along the right border were skipped due to crowding.
basemap [WARNING]: Crowding decisions is controlled by MAP_ANNOT_MIN_SPACING, currently set to 22.6964p.
basemap [WARNING]: Decrease or increase MAP_ANNOT_MIN_SPACING to see more or fewer annotations, with 0 showing all annotations.
<IPython.core.display.Image object>
import pygmt

fig = pygmt.Figure()

pygmt.config(FONT_TITLE="14p,Helvetica,black", FORMAT_GEO_MAP="+D")

# ============

fig.basemap(
    # set map limits to theta_min = 0, theta_max = 360, radius_min = 0, radius_max = 1
    region=[0, 360, 0, 1],
    # set map width to 5 cm
    projection="P5c",
    # set the frame and color
    frame=["xa45f", "+gbisque"],
)

fig.text(position="TC", text="projection='P5c'", offset="0/2.0c", no_clip=True)
fig.text(position="TC", text="region=[0, 360, 0, 1]", offset="0/1.5c", no_clip=True)

fig.shift_origin(xshift="8c")

# ============
fig.basemap(
    # set map limits to theta_min = 0, theta_max = 360, radius_min = 0, radius_max = 1
    region=[0, 360, 0, 1],
    # set map width to 5 cm and interpret input data as geographic azimuth instead
    # of standard angle
    projection="P5c+a",
    # set the frame and color
    frame=["xa45f", "+gbisque"],
)

fig.text(position="TC", text="projection='P5c+a'", offset="0/2.0c", no_clip=True)
fig.text(position="TC", text="region=[0, 360, 0, 1]", offset="0/1.5c", no_clip=True)

fig.shift_origin(xshift="8c")

# ============
fig.basemap(
    # set map limits to theta_min = 0, theta_max = 90, radius_min = 0, radius_max = 1
    region=[0, 90, 0, 1],
    # set map width to 5 cm and interpret input data as geographic azimuth instead
    # of standard angle
    projection="P5c+a",
    # set the frame and color
    frame=["xa45f", "ya0.2", "WNe+gbisque"],
)

fig.text(position="TC", text="projection='P5c+a'", offset="0/2.0c", no_clip=True)
fig.text(position="TC", text="region=[0, 90, 0, 1]", offset="0/1.5c", no_clip=True)

fig.shift_origin(xshift="-16c", yshift="-7c")

# ============
fig.basemap(
    # set map limits to theta_min = 0, theta_max = 90, radius_min = 0, radius_max = 1
    region=[0, 90, 0, 1],
    # set map width to 5 cm and interpret input data as geographic azimuth instead
    # of standard angle, rotate coordinate system counterclockwise by 45 degrees
    projection="P5c+a+t45",
    # set the frame and color
    frame=["xa30f", "ya0.2", "WNe+gbisque"],
)

fig.text(position="TC", text="projection='P5c+a\+t45'", offset="0/2.0c", no_clip=True)
fig.text(position="TC", text="region=[0, 90, 0, 1]", offset="0/1.5c", no_clip=True)

fig.shift_origin(xshift="8c", yshift="1.3c")

# ============
fig.basemap(
    # set map limits to theta_min = 0, theta_max = 90, radius_min = 3480,
    # radius_max = 6371 (Earth's radius)
    region=[0, 90, 3480, 6371],
    # set map width to 5 cm and interpret input data as geographic azimuth instead
    # of standard angle, rotate coordinate system counterclockwise by 45 degrees
    projection="P5c+a+t45",
    # set the frame and color
    frame=["xa30f", "ya", "WNse+gbisque"],
)

fig.text(position="TC", text="projection='P5c+a\+t45'", offset="0/2.0c", no_clip=True)
fig.text(
    position="TC", text="region=[0, 90, 3480, 6371]", offset="0/1.5c", no_clip=True
)

fig.shift_origin(xshift="8c")

# ============
fig.basemap(
    # set map limits to theta_min = 0, theta_max = 90, radius_min = 3480,
    # radius_max = 6371 (Earth's radius)
    region=[0, 90, 3480, 6371],
    # set map width to 5 cm and interpret input data as geographic azimuth instead
    # of standard angle, rotate coordinate system counterclockwise by 45 degrees,
    # r axis is marked as depth
    projection="P5c+a+t45+z",
    # set the frame and color
    frame=["xa30f", "ya", "WNse+gbisque"],
)

fig.text(position="TC", text="projection='P5c+a\+t45+z'", offset="0/2.0c", no_clip=True)
fig.text(
    position="TC", text="region=[0, 90, 3480, 6371]", offset="0/1.5c", no_clip=True
)

fig.show()
Total running time of the script: ( 0 minutes 3.896 seconds)