pygmt.Figure.inset
- Figure.inset(*, position=None, box=None, margin=None, no_clip=None, verbose=None, **kwargs)
Create an inset figure to be placed within a larger figure.
This function sets the position, frame, and margins for a smaller figure inside of the larger figure. Plotting functions that are called within the context manager are added to the inset figure.
Full option list at https://docs.generic-mapping-tools.org/latest/inset.html
Aliases:
D = position
F = box
M = margin
N = no_clip
V = verbose
- Parameters
xmin/xmax/ymin/ymax[+r][+uunit]] | [g|j|J|n|x]refpoint+wwidth[/height][+jjustify][+odx[/dy]].
This is the only required parameter. Define the map inset rectangle on the map. Specify the rectangle in one of three ways:
Append glon/lat for map (user) coordinates, jcode or Jcode for setting the refpoint via a 2-char justification code that refers to the (invisible) projected map bounding box, nxn/yn for normalized (0-1) bounding box coordinates, or xx/y for plot coordinates (inches, cm, points, append unit). All but x requires both
regionandprojectionto be specified. You can offset the reference point via +odx/dy in the direction implied by code or +jjustify.Alternatively, give west/east/south/north of geographic rectangle bounded by parallels and meridians; append +r if the coordinates instead are the lower left and upper right corners of the desired rectangle. (Or, give xmin/xmax/ymin/ymax of bounding rectangle in projected coordinates and optionally append +uunit [Default coordinate unit is meter (e)].
Append +wwidth[/height] of bounding rectangle or box in plot coordinates (inches, cm, etc.). By default, the anchor point on the scale is assumed to be the bottom left corner (BL), but this can be changed by appending +j followed by a 2-char justification code justify. Note: If j is used then justify defaults to the same as refpoint, if J is used then justify defaults to the mirror opposite of refpoint. Specify inset box attributes via the
boxparameter [Default is outline only].[+cclearances][+gfill][+i[[gap/]pen]][+p[pen]][+r[radius]][+s[[dx/dy/][shade]]].
If passed
True, this draws a rectangular box around the map inset using the default pen; specify a different pen with +ppen. Add +gfill to fill the logo box [Default is no fill]. Append +cclearance where clearance is either gap, xgap/ygap, or lgap/rgap/bgap/tgap where these items are uniform, separate in x- and y-direction, or individual side spacings between logo and border. Append +i to draw a secondary, inner border as well. We use a uniform gap between borders of 2p and the default pen unless other values are specified. Append +r to draw rounded rectangular borders instead, with a 6p corner radius. You can override this radius by appending another value. Append +s to draw an offset background shaded region. Here, dx/dy indicates the shift relative to the foreground frame [4p/-4p] andshadesets the fill style to use for shading [Default is gray50].margin (int or str or list) – This is clearance that is added around the inside of the inset. Plotting will take place within the inner region only. The margins can be a single value, a pair of values separated (for setting separate horizontal and vertical margins), or the full set of four margins (for setting separate left, right, bottom, and top margins). When passing multiple values, it can be either a list or a string with the values separated by forward slashes [Default is no margins].
no_clip (bool) – Do NOT clip features extruding outside map inset boundaries [Default is clip].
Select verbosity level [Default is w], which modulates the messages written to stderr. Choose among 7 levels of verbosity:
q - Quiet, not even fatal error messages are produced
e - Error messages only
w - Warnings [Default]
t - Timings (report runtimes for time-intensive algorithms);
i - Informational messages (same as
verbose=True)c - Compatibility warnings
d - Debugging messages
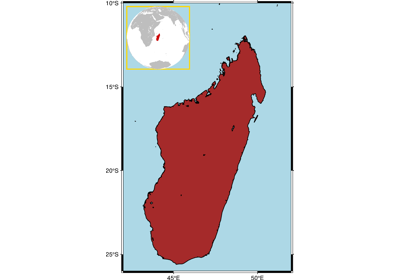
Examples
>>> import pygmt
>>>
>>> # Create the larger figure
>>> fig = pygmt.Figure()
>>> fig.coast(region="MG+r2", water="lightblue", shorelines="thin")
>>> # Use a "with" statement to initialize the inset context manager
>>> # Setting the position to top left and a width of 3.5 centimeters
>>> with fig.inset(position="jTL+w3.5c+o0.2c", margin=0, box="+pgreen"):
...     # Map elements under the "with" statement are plotted in the inset
...     fig.coast(
...         region="g",
...         projection="G47/-20/3.5c",
...         land="gray",
...         water="white",
...         dcw="MG+gred",
...     )
...
>>> # Map elements outside the "with" block are plotted in the main figure
>>> fig.logo(position="jBR+o0.2c+w3c")
>>> fig.show()
<IPython.core.display.Image object>