pygmt.Figure.legend
- Figure.legend(spec=None, position='JTR+jTR+o0.2c', box='+gwhite+p1p', *, region=None, projection=None, timestamp=None, verbose=None, xshift=None, yshift=None, panel=None, perspective=None, transparency=None, **kwargs)
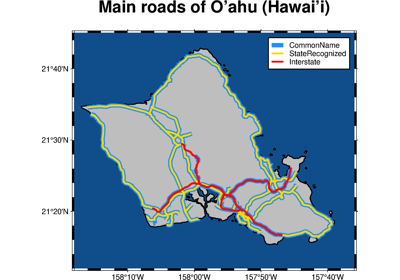
Plot legends on maps.
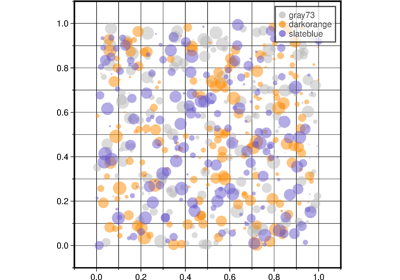
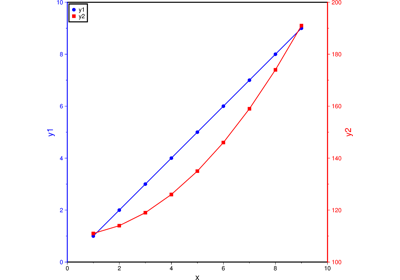
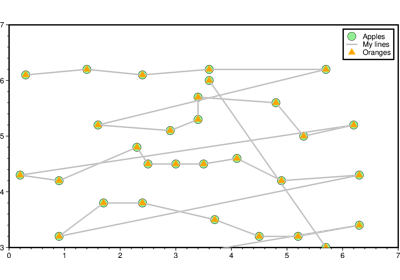
Makes legends that can be overlaid on maps. Reads specific legend-related information from an input file, or automatically creates legend entries from plotted symbols that have labels. Unless otherwise noted, annotations will be made using the primary annotation font and size in effect (i.e., FONT_ANNOT_PRIMARY).
Full option list at https://docs.generic-mapping-tools.org/latest/legend.html
Aliases:
D = position
F = box
J = projection
R = region
U = timestamp
V = verbose
X = xshift
Y = yshift
c = panel
p = perspective
t = transparency
- Parameters
spec (None or str) – Either
None[default] for using the automatically generated legend specification file, or a filename pointing to the legend specification file.projection (str) – projcode[projparams/]width. Select map projection.
region (str or list) – xmin/xmax/ymin/ymax[+r][+uunit]. Specify the region of interest.
position (str) – [g|j|J|n|x]refpoint+wwidth[/height][+jjustify][+lspacing][+odx[/dy]]. Defines the reference point on the map for the legend. By default, uses JTR+jTR+o0.2c which places the legend at the top-right corner inside the map frame, with a 0.2 cm offset.
box (bool or str) – [+cclearances][+gfill][+i[[gap/]pen]][+p[pen]][+r[radius]][+s[[dx/dy/][shade]]]. Without further arguments, draws a rectangular border around the legend using MAP_FRAME_PEN. By default, uses +gwhite+p1p which draws a box around the legend using a 1p black pen and adds a white background.
Select verbosity level [Default is w], which modulates the messages written to stderr. Choose among 7 levels of verbosity:
q - Quiet, not even fatal error messages are produced
e - Error messages only
w - Warnings [Default]
t - Timings (report runtimes for time-intensive algorithms);
i - Informational messages (same as
verbose=True)c - Compatibility warnings
d - Debugging messages
xshift (str) – [a|c|f|r][xshift]. Shift plot origin in x-direction.
yshift (str) – [a|c|f|r][yshift]. Shift plot origin in y-direction. Full documentation is at https://docs.generic-mapping-tools.org/latest/gmt.html#xy-full.
panel (bool or int or list) – [row,col|index]. Select a specific subplot panel. Only allowed when in subplot mode. Use
panel=Trueto advance to the next panel in the selected order. Instead of row,col you may also give a scalar value index which depends on the order you set viaautolabelwhen the subplot was defined. Note: row, col, and index all start at 0.perspective (list or str) – [x|y|z]azim[/elev[/zlevel]][+wlon0/lat0[/z0]][+vx0/y0]. Select perspective view and set the azimuth and elevation angle of the viewpoint. Default is [180, 90]. Full documentation is at https://docs.generic-mapping-tools.org/latest/gmt.html#perspective-full.
transparency (int or float) – Set transparency level, in [0-100] percent range. Default is 0, i.e., opaque. Only visible when PDF or raster format output is selected. Only the PNG format selection adds a transparency layer in the image (for further processing).