pygmt.grdhisteq.compute_bins
- static grdhisteq.compute_bins(grid, *, output_type='pandas', outfile=None, divisions=None, quadratic=None, verbose=None, region=None, header=None)[source]
Perform histogram equalization for a grid.
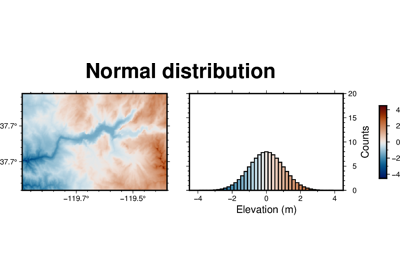
Histogram equalization provides a way to highlight data that has most values clustered in a small portion of the dynamic range, such as a grid of flat topography with a mountain in the middle. Ordinary gray shading of this grid (using
pygmt.Figure.grdimageorpygmt.Figure.grdview) with a linear mapping from topography to graytone will result in most of the image being very dark gray, with the mountain being almost white.pygmt.grdhisteq.compute_binscan provide a list of data values that divide the data range into divisions which have an equal area in the image [Default is 16 ifdivisionsis not set]. Thepandas.DataFrameor ASCII file output can be used to make a colormap withpygmt.makecptand an image withpygmt.Figure.grdimagethat has all levels of gray occuring equally.Full option list at https://docs.generic-mapping-tools.org/latest/grdhisteq.html
- Parameters
grid (str or xarray.DataArray) – The file name of the input grid or the grid loaded as a DataArray.
outfile (str or bool or None) – The name of the output ASCII file to store the results of the histogram equalization in.
output_type (str) –
Determine the format the xyz data will be returned in [Default is
pandas]:numpy-numpy.ndarraypandas-pandas.DataFramefile- ASCII file (requiresoutfile)
divisions (int) – Set the number of divisions of the data range.
quadratic (bool) – Perform quadratic equalization [Default is linear].
region (str or list) – xmin/xmax/ymin/ymax[+r][+uunit]. Specify the region of interest.
Select verbosity level [Default is w], which modulates the messages written to stderr. Choose among 7 levels of verbosity:
q - Quiet, not even fatal error messages are produced
e - Error messages only
w - Warnings [Default]
t - Timings (report runtimes for time-intensive algorithms);
i - Informational messages (same as
verbose=True)c - Compatibility warnings
d - Debugging messages
header (str) –
[i|o][n][+c][+d][+msegheader][+rremark][+ttitle]. Specify that input and/or output file(s) have n header records [Default is 0]. Prepend i if only the primary input should have header records. Prepend o to control the writing of header records, with the following modifiers supported:
+d to remove existing header records.
+c to add a header comment with column names to the output [Default is no column names].
+m to add a segment header segheader to the output after the header block [Default is no segment header].
+r to add a remark comment to the output [Default is no comment]. The remark string may contain \n to indicate line-breaks.
+t to add a title comment to the output [Default is no title]. The title string may contain \n to indicate line-breaks.
Blank lines and lines starting with # are always skipped.
- Returns
ret (pandas.DataFrame or numpy.ndarray or None) – Return type depends on
outfileandoutput_type:None if
outfileis set (output will be stored in file set byoutfile)pandas.DataFrameornumpy.ndarrayifoutfileis not set (depends onoutput_type)
Example
>>> import pygmt
>>> # Load a grid of @earth_relief_30m data, with an x-range of 10 to
>>> # 30, and a y-range of 15 to 25
>>> grid = pygmt.datasets.load_earth_relief(
...     resolution="30m", region=[10, 30, 15, 25]
... )
>>> # Find elevation intervals that splits the data range into 5
>>> # divisions, each of which have an equal area in the original grid.
>>> bins = pygmt.grdhisteq.compute_bins(grid=grid, divisions=5)
>>> print(bins)
        start    stop
bin_id
0       179.0   397.5
1       397.5   475.5
2       475.5   573.5
3       573.5   710.5
4       710.5  2103.0
See also
Note
This method does a weighted histogram equalization for geographic grids to account for node area varying with latitude.