Note
Click here to download the full example code
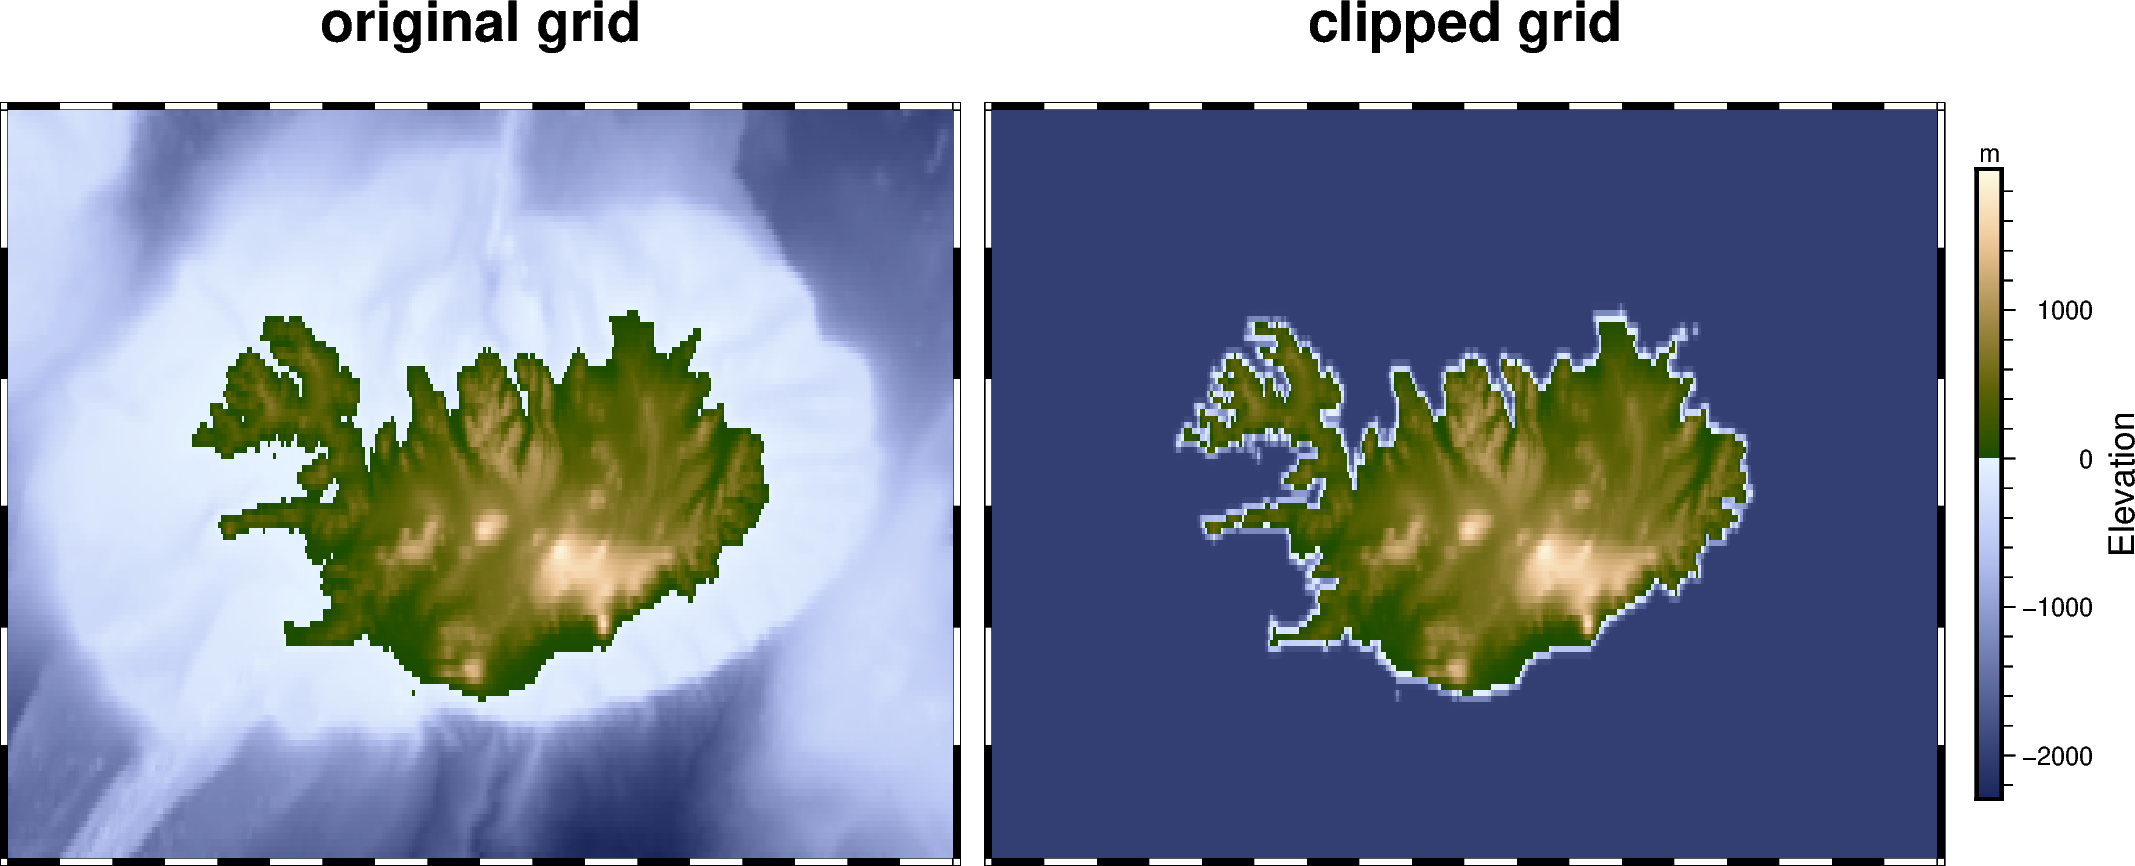
Clipping grid values
The pygmt.grdclip method allows to clip defined ranges of grid values.
In the example shown below we set all elevation values (grid points) smaller
than 0 m (in general the bathymetric part of the grid) to a common value of
-2000 m via the below parameter.
Out:
<IPython.core.display.Image object>
import pygmt

fig = pygmt.Figure()

# Define region of interest around Iceland
region = [-28, -10, 62, 68]

# Load sample grid (3 arc minute global relief) in target area
grid = pygmt.datasets.load_earth_relief(resolution="03m", region=region)

# Plot original grid
fig.basemap(region=region, projection="M12c", frame=["f", '+t"original grid"'])
fig.grdimage(grid=grid, cmap="oleron")

# Shift plot origin of the second map by "width of the first map + 0.5 cm"
# in x direction
fig.shift_origin(xshift="w+0.5c")

# Set all grid points < 0 m to a value of -2000 m.
grid = pygmt.grdclip(grid, below=[0, -2000])

# Plot clipped grid
fig.basemap(region=region, projection="M12c", frame=["f", '+t"clipped grid"'])
fig.grdimage(grid=grid)
fig.colorbar(frame=["x+lElevation", "y+lm"], position="JMR+o0.5c/0c+w8c")

fig.show()
Total running time of the script: ( 0 minutes 2.377 seconds)