Note
Click here to download the full example code
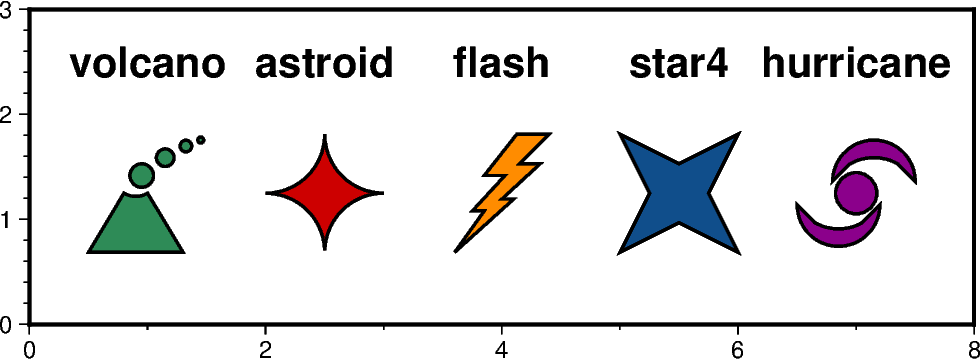
Custom symbols
The pygmt.Figure.plot method can plot individual custom symbols
by passing the corresponding symbol name together with the k shortcut to
the style parameter. In total 41 custom symbols are already included of
which the following plot shows five exemplary ones. The symbols are shown
underneath their corresponding names. For the remaining symbols see the GMT
cookbook https://docs.generic-mapping-tools.org/latest/cookbook/custom-symbols.html.
Out:
<IPython.core.display.Image object>
import pygmt

fig = pygmt.Figure()
fig.basemap(region=[0, 8, 0, 3], projection="X12c/4c", frame=True)

# define pen and fontstlye for annotations
pen = "1p,black"
font = "15p,Helvetica-Bold"

# use the volcano symbol with a size of 1.5c,
# fill color is set to "seagreen"
fig.plot(x=1, y=1.25, style="kvolcano/1.5c", pen=pen, color="seagreen")
fig.text(x=1, y=2.5, text="volcano", font=font)

# use the astroid symbol with a size of 1.5c,
# fill color is set to "red3"
fig.plot(x=2.5, y=1.25, style="kastroid/1.5c", pen=pen, color="red3")
fig.text(x=2.5, y=2.5, text="astroid", font=font)

# use the flash symbol with a size of 1.5c,
# fill color is set to "darkorange"
fig.plot(x=4, y=1.25, style="kflash/1.5c", pen=pen, color="darkorange")
fig.text(x=4, y=2.5, text="flash", font=font)

# use the star4 symbol with a size of 1.5c,
# fill color is set to "dodgerblue4"
fig.plot(x=5.5, y=1.25, style="kstar4/1.5c", pen=pen, color="dodgerblue4")
fig.text(x=5.5, y=2.5, text="star4", font=font)

# use the hurricane symbol with a size of 1.5c,
# fill color is set to "magenta4"
fig.plot(x=7, y=1.25, style="khurricane/1.5c", pen=pen, color="magenta4")
fig.text(x=7, y=2.5, text="hurricane", font=font)

fig.show()
Total running time of the script: ( 0 minutes 2.357 seconds)