Note
Click here to download the full example code
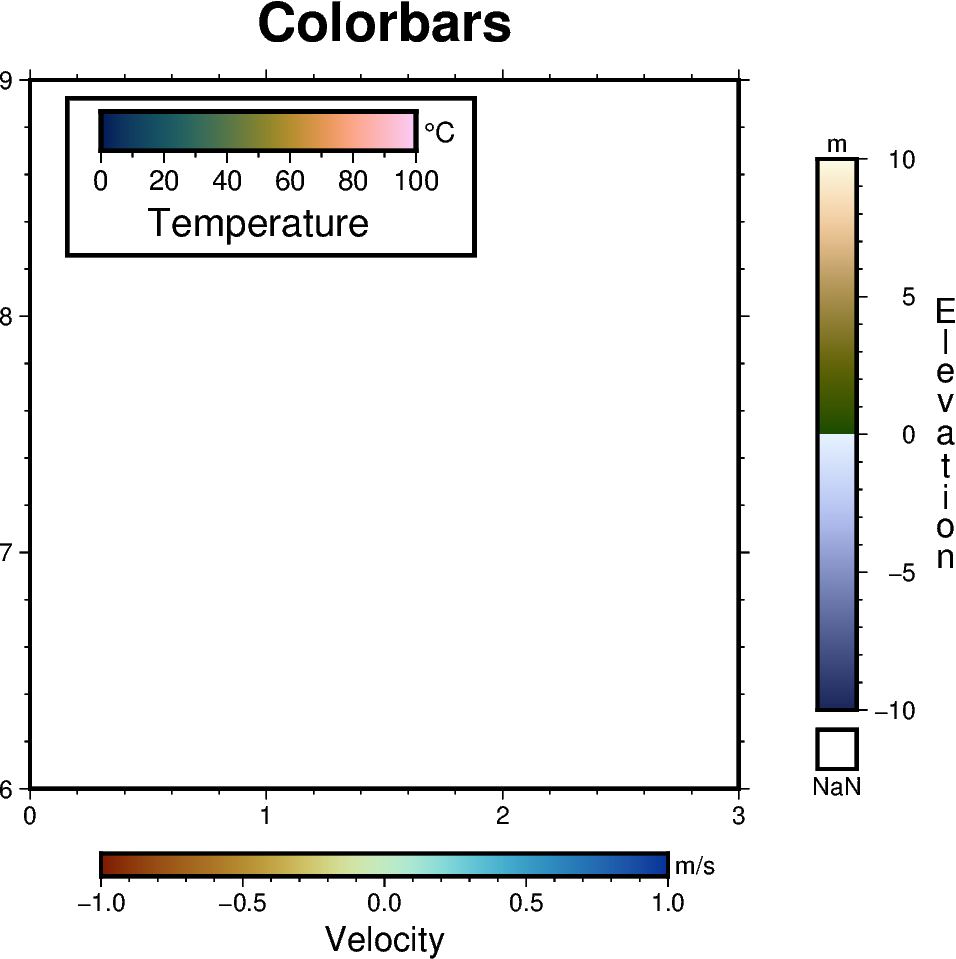
Colorbar
The pygmt.Figure.colorbar method creates a color scalebar. We must
specify the colormap via the cmap parameter, and optionally set the
placement via the position parameter. The full list of color palette tables
can be found at https://docs.generic-mapping-tools.org/latest/cookbook/cpts.html. You can set the position of
the colorbar using the following options:
j/J: justified inside/outside the map frame using any 2 character combination of vertical (Top, Middle, Bottom) and horizontal (Left, Center, Right) alignment codes, e.g.
position="jTR"for top right.g: using map coordinates, e.g.
position="g170/-45"for longitude 170E, latitude 45S.x: using paper coordinates, e.g.
position="x5c/7c"for 5 cm,7 cm from anchor point.n: using normalized (0-1) coordinates, e.g.
position="n0.4/0.8".
Note that the anchor point defaults to the bottom left (BL). Append +h
to position to get a horizontal colorbar instead of a vertical one.
Out:
<IPython.core.display.Image object>
import pygmt

fig = pygmt.Figure()
fig.basemap(region=[0, 3, 6, 9], projection="x3c", frame=["af", 'WSne+t"Colorbars"'])

## Create a colorbar designed for seismic tomography - roma
# Colorbar is placed at bottom center (BC) by default if no position is given
fig.colorbar(cmap="roma", frame=["x+lVelocity", "y+lm/s"])

## Create a colorbar showing the scientific rainbow - batlow
fig.colorbar(
    cmap="batlow",
    # Colorbar positioned at map coordinates (g) longitude/latitude 0.3/8.7,
    # with a length/width (+w) of 4 cm by 0.5 cm, and plotted horizontally (+h)
    position="g0.3/8.7+w4c/0.5c+h",
    box=True,
    frame=["x+lTemperature", r"y+l\260C"],
    scale=100,
)

## Create a colorbar suitable for surface topography - oleron
fig.colorbar(
    cmap="oleron",
    # Colorbar position justified outside map frame (J) at Middle Right (MR),
    # offset (+o) by 1 cm horizontally and 0 cm vertically from anchor point,
    # with a length/width (+w) of 7 cm by 0.5 cm and a box for NaN values (+n)
    position="JMR+o1c/0c+w7c/0.5c+n+mc",
    # Note that the label 'Elevation' is moved to the opposite side and plotted
    # vertically as a column of text using '+mc' in the position parameter
    # above
    frame=["x+lElevation", "y+lm"],
    scale=10,
)

fig.show()
Total running time of the script: ( 0 minutes 1.173 seconds)