Note
Click here to download the full example code
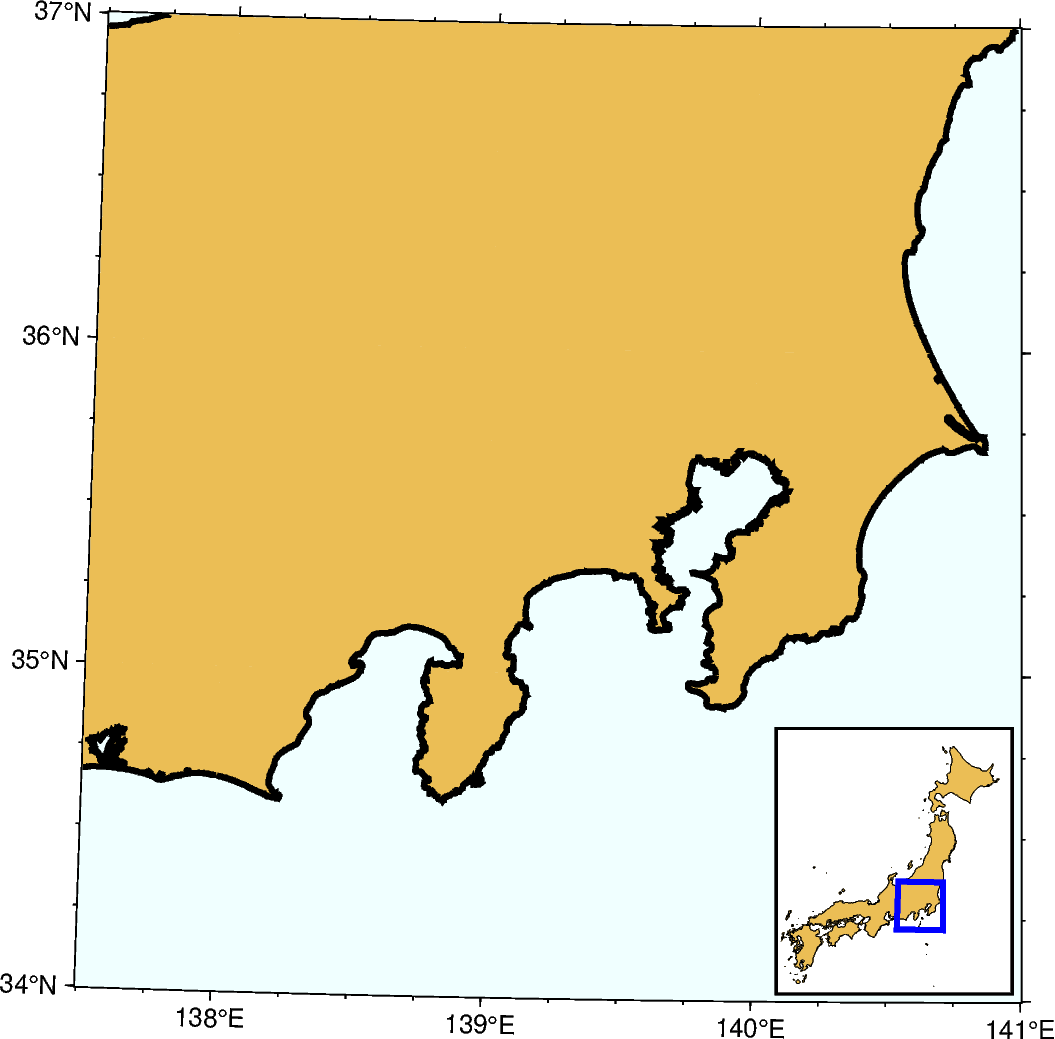
Inset map showing a rectangular region
The pygmt.Figure.inset method adds an inset figure inside a larger
figure. The function is called using a with statement, and its
position, box, offset, and margin can be customized. Plotting
methods called within the with statement plot into the inset figure.
Out:
<IPython.core.display.Image object>
import pygmt

# Set the region of the main figure
region = [137.5, 141, 34, 37]

fig = pygmt.Figure()

# Plot the base map of the main figure. Universal Transverse Mercator (UTM)
# projection is used and the UTM zone is set to be "54S".
fig.basemap(region=region, projection="U54S/12c", frame=["WSne", "af"])

# Set the land color to "lightbrown", the water color to "azure1", the
# shoreline width to "2p", and the area threshold to 1000 km^2 for the main
# figure
fig.coast(land="lightbrown", water="azure1", shorelines="2p", area_thresh=1000)

# Create an inset map, setting the position to bottom right, and the x- and
# y-offsets to 0.1 cm, respectively.
# The inset map contains the Japan main land. "U54S/3c" means UTM projection
# with a map width of 3 cm. The inset width and height are automatically
# calculated from the specified ``region`` and ``projection`` parameters.
# Draws a rectangular box around the inset with a fill color of "white" and
# a pen of "1p".
with fig.inset(
    position="jBR+o0.1c",
    box="+gwhite+p1p",
    region=[129, 146, 30, 46],
    projection="U54S/3c",
):
    # Highlight the Japan area in "lightbrown"
    # and draw its outline with a pen of "0.2p".
    fig.coast(
        dcw="JP+glightbrown+p0.2p",
        area_thresh=10000,
    )
    # Plot a rectangle ("r") in the inset map to show the area of the main
    # figure. "+s" means that the first two columns are the longitude and
    # latitude of the bottom left corner of the rectangle, and the last two
    # columns the longitude and latitude of the uppper right corner.
    rectangle = [[region[0], region[2], region[1], region[3]]]
    fig.plot(data=rectangle, style="r+s", pen="2p,blue")

fig.show()
Total running time of the script: ( 0 minutes 1.669 seconds)