Note
Click here to download the full example code
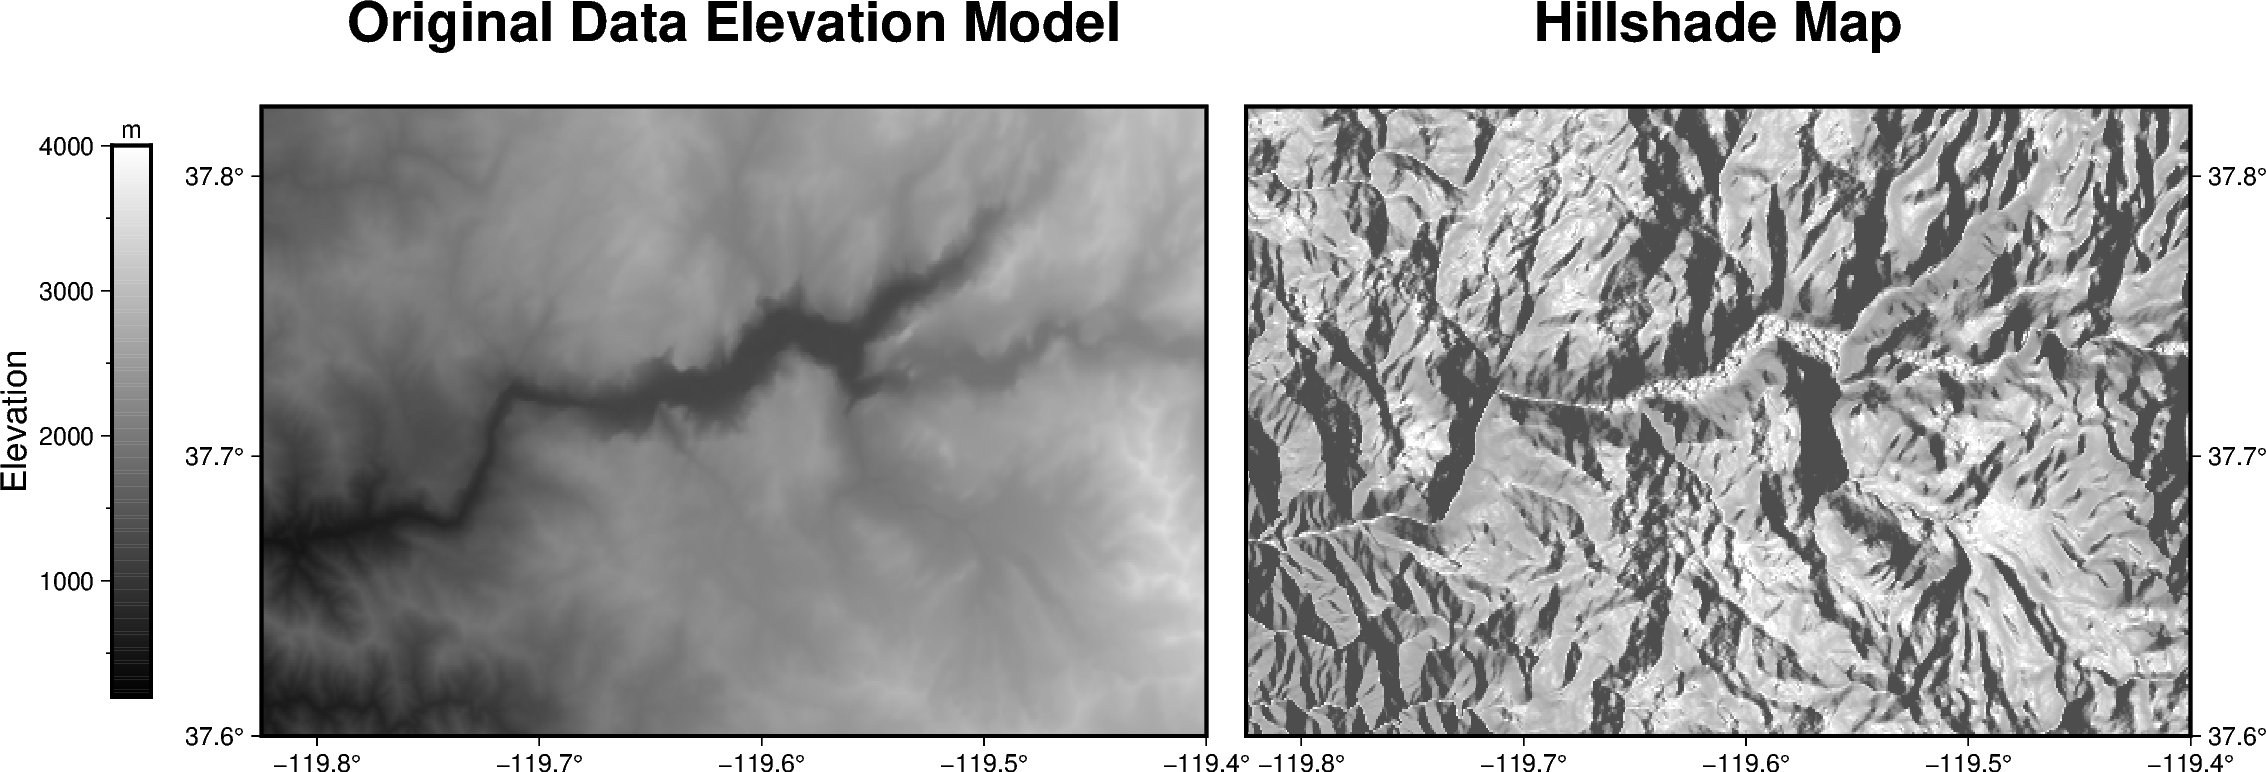
Calculating grid gradient and radiance
The pygmt.grdgradient function calculates the gradient of a grid file.
In the example shown below we will see how to calculate a hillshade map based
on a Data Elevation Model (DEM). As input pygmt.grdgradient gets
a xarray.DataArray object or a path string to a grid file, calculates
the respective gradient and returns it as an xarray.DataArray object.
We will use the radiance parameter in order to set the illumination source
direction and altitude.
<IPython.core.display.Image object>
import pygmt

# Define region of interest around Yosemite valley
region = [-119.825, -119.4, 37.6, 37.825]

# Load sample grid (3 arc-seconds global relief) in target area
grid = pygmt.datasets.load_earth_relief(resolution="03s", region=region)

# calculate the reflection of a light source projecting from west to east
# (azimuth of 270 degrees) and at a latitude of 30 degrees from the horizon
dgrid = pygmt.grdgradient(grid=grid, radiance=[270, 30])

fig = pygmt.Figure()
# define figure configuration
pygmt.config(FORMAT_GEO_MAP="ddd.x", MAP_FRAME_TYPE="plain")

# --------------- plotting the original Data Elevation Model -----------

pygmt.makecpt(cmap="gray", series=[200, 4000, 10])
fig.grdimage(
    grid=grid,
    projection="M12c",
    frame=["WSrt+tOriginal Data Elevation Model", "xa0.1", "ya0.1"],
    cmap=True,
)

fig.colorbar(position="JML+o1.4c/0c+w7c/0.5c", frame=["xa1000f500+lElevation", "y+lm"])

# --------------- plotting the hillshade map -----------

# Shift plot origin of the second map by 12.5 cm in x direction
fig.shift_origin(xshift="12.5c")

pygmt.makecpt(cmap="gray", series=[-1.5, 0.3, 0.01])
fig.grdimage(
    grid=dgrid,
    projection="M12c",
    frame=["lSEt+tHillshade Map", "xa0.1", "ya0.1"],
    cmap=True,
)

fig.show()
Total running time of the script: ( 0 minutes 2.315 seconds)