pygmt.Figure

class pygmt.Figure[source]

A GMT figure to handle all plotting.

Use the plotting methods of this class to add elements to the figure. You can preview the figure using pygmt.Figure.show and save the figure to a file using pygmt.Figure.savefig.

Unlike traditional GMT figures, no figure file is generated until you call pygmt.Figure.savefig or pygmt.Figure.psconvert.

Examples

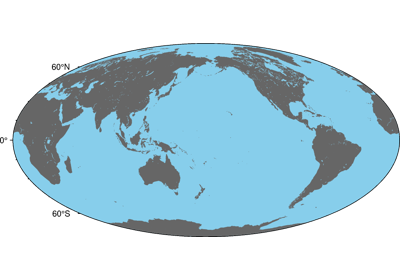
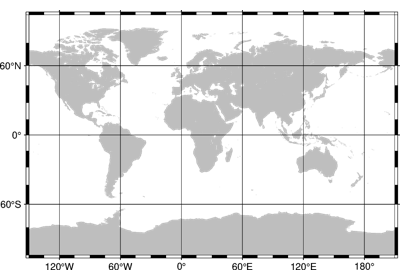
>>> import pygmt
>>> fig = pygmt.Figure()
>>> fig.basemap(region=[0, 360, -90, 90], projection="W15c", frame=True)
>>> fig.savefig("my-figure.png")
>>> # Make sure the figure file is generated and clean it up
>>> import os
>>> os.path.exists("my-figure.png")
True
>>> os.remove("my-figure.png")

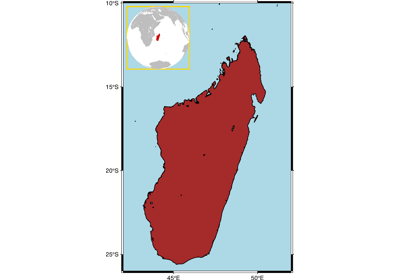
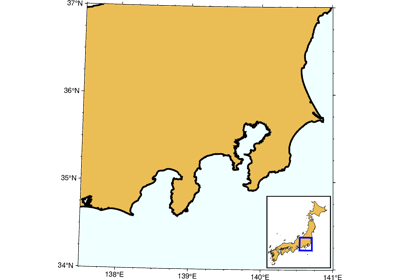
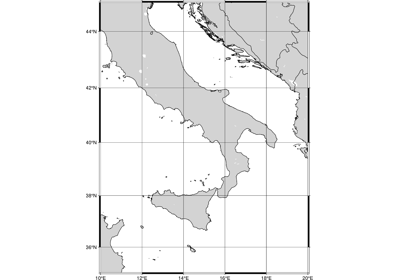
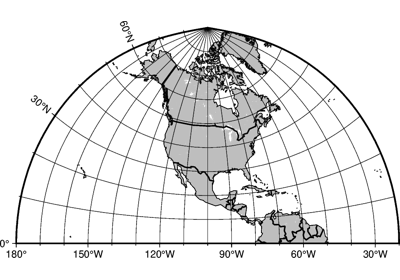
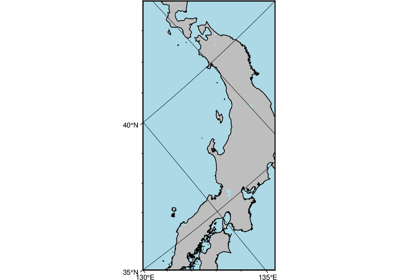
The plot region can be specified through ISO country codes (for example,
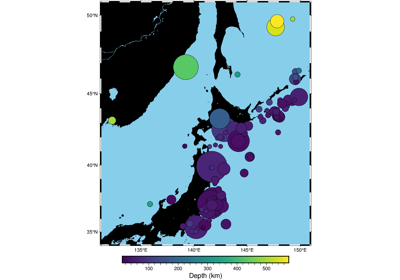
 "JP" for Japan):

>>> import pygmt
>>> fig = pygmt.Figure()
>>> fig.basemap(region="JP", projection="M7c", frame=True)
>>> # The fig.region attribute shows the WESN bounding box for the figure
>>> print(", ".join(f"{i:.2f}" for i in fig.region))
122.94, 145.82, 20.53, 45.52

Methods Summary

Figure.basemap(*[, region, projection, ...])

Plot base maps and frames for the figure.

Figure.coast(*[, region, projection, ...])

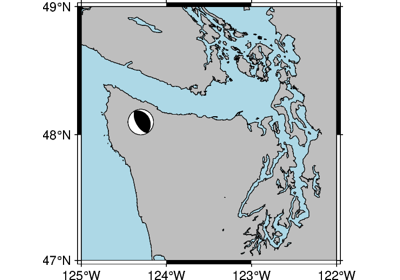
Plot continents, shorelines, rivers, and borders on maps.

Figure.colorbar(*[, region, projection, ...])

Plot a gray or color scale-bar on maps.

Figure.contour([data, x, y, z, annotation, ...])

Contour table data by direct triangulation.

Figure.grdcontour(grid, *[, annotation, ...])

Convert grids or images to contours and plot them on maps.

Figure.grdimage(grid, *[, img_out, frame, ...])

Project and plot grids or images.

Figure.grdview(grid, *[, region, ...])

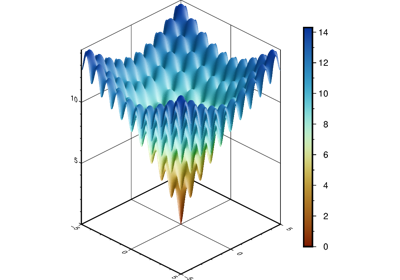
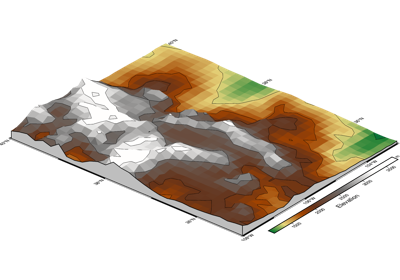
Create 3-D perspective image or surface mesh from a grid.

Figure.histogram(data, *[, horizontal, ...])

Plots a histogram, and can read data from a file or list, array, or dataframe.

Figure.image(imagefile, *[, region, ...])

Place images or EPS files on maps.

Figure.inset(*[, position, box, projection, ...])

Create an inset figure to be placed within a larger figure.

Figure.legend([spec, position, box, region, ...])

Plot legends on maps.

Figure.logo(*[, region, projection, ...])

Plot the GMT logo.

Figure.meca(spec, scale[, convention, ...])

Plot focal mechanisms.

Figure.plot([data, x, y, size, direction, ...])

Plot lines, polygons, and symbols in 2-D.

Figure.plot3d([data, x, y, z, size, ...])

Plot lines, polygons, and symbols in 3-D.

Figure.psconvert(*[, crop, gs_option, dpi, ...])

Convert [E]PS file(s) to other formats.

Figure.rose([data, length, azimuth, sector, ...])

Plot windrose diagrams or polar histograms.

Figure.savefig(fname[, transparent, crop, ...])

Save the figure to a file.

Figure.set_panel([panel, fixedlabel, ...])

Set the current subplot panel to plot on.

Figure.shift_origin([xshift, yshift])

Shift plot origin in x and/or y directions.

Figure.show([dpi, width, method, waiting])

Display a preview of the figure.

Figure.solar([terminator, ...])

Plot day-light terminators or twilights.

Figure.subplot([nrows, ncols, figsize, ...])

Create multi-panel subplot figures.

Figure.ternary(data[, alabel, blabel, ...])

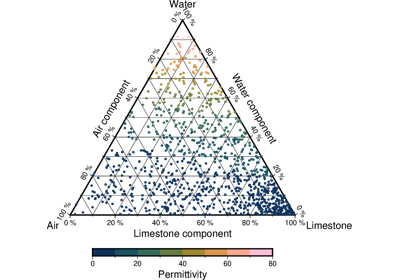
Reads (a,b,c[,z]) records from data and plots symbols at those locations on a ternary diagram.

Figure.text([textfiles, x, y, position, ...])

Plot or typeset text strings of variable size, font type, and orientation.

Figure.velo([data, vector, frame, cmap, ...])

Plot velocity vectors, crosses, anisotropy bars, and wedges.

Figure.wiggle([data, x, y, z, fillpositive, ...])

Plot z=f(x,y) anomalies along tracks.

Examples using pygmt.Figure

Color land and water

Color land and water

Color land and water
Political Boundaries

Political Boundaries

Political Boundaries
Shorelines

Shorelines

Shorelines
Cartesian, circular, and geographic vectors

Cartesian, circular, and geographic vectors

Cartesian, circular, and geographic vectors
Generate points along great circles

Generate points along great circles

Generate points along great circles
Line colors with a custom CPT

Line colors with a custom CPT

Line colors with a custom CPT
Line fronts

Line fronts

Line fronts
Line styles

Line styles

Line styles
Roads

Roads

Roads
Vector heads and tails

Vector heads and tails

Vector heads and tails
Wiggle along tracks

Wiggle along tracks

Wiggle along tracks
Basic geometric symbols

Basic geometric symbols

Basic geometric symbols
Color points by categories

Color points by categories

Color points by categories
Custom symbols

Custom symbols

Custom symbols
Datetime inputs

Datetime inputs

Datetime inputs
Multi-parameter symbols

Multi-parameter symbols

Multi-parameter symbols
Points

Points

Points
Points with varying transparency

Points with varying transparency

Points with varying transparency
Scatter plots with a legend

Scatter plots with a legend

Scatter plots with a legend
Text symbols

Text symbols

Text symbols
Vertical or horizontal bars

Vertical or horizontal bars

Vertical or horizontal bars
Calculating grid gradient and radiance

Calculating grid gradient and radiance

Calculating grid gradient and radiance
Clipping grid values

Clipping grid values

Clipping grid values
Contours

Contours

Contours
Create 'wet-dry' mask grid

Create ‘wet-dry’ mask grid

Create 'wet-dry' mask grid
Images on figures

Images on figures

Images on figures
Sampling along tracks

Sampling along tracks

Sampling along tracks
3-D Scatter plots

3-D Scatter plots

3-D Scatter plots
Plotting a surface

Plotting a surface

Plotting a surface
Focal mechanisms

Focal mechanisms

Focal mechanisms
Velocity arrows and confidence ellipses

Velocity arrows and confidence ellipses

Velocity arrows and confidence ellipses
Double Y axes graph

Double Y axes graph

Double Y axes graph
Ternary diagram

Ternary diagram

Ternary diagram
Blockmean

Blockmean

Blockmean
Histogram

Histogram

Histogram
Rose diagram

Rose diagram

Rose diagram
Colorbar

Colorbar

Colorbar
Day-night terminator line and twilights

Day-night terminator line and twilights

Day-night terminator line and twilights
Inset

Inset

Inset
Inset map showing a rectangular region

Inset map showing a rectangular region

Inset map showing a rectangular region
Legend

Legend

Legend
Logo

Logo

Logo
Multiple colormaps

Multiple colormaps

Multiple colormaps
Coastlines and borders

Coastlines and borders

Coastlines and borders
Frames, ticks, titles, and labels

Frames, ticks, titles, and labels

Frames, ticks, titles, and labels
Plotting data points

Plotting data points

Plotting data points
Plotting lines

Plotting lines

Plotting lines
Plotting text

Plotting text

Plotting text
Setting the region

Setting the region

Setting the region
Adding an inset to the figure

Adding an inset to the figure

Adding an inset to the figure
Configuring PyGMT defaults

Configuring PyGMT defaults

Configuring PyGMT defaults
Creating a 3-D perspective image

Creating a 3-D perspective image

Creating a 3-D perspective image
Creating a map with contour lines

Creating a map with contour lines

Creating a map with contour lines
Making subplots

Making subplots

Making subplots
Performing grid histogram equalization

Performing grid histogram equalization

Performing grid histogram equalization
Plotting Earth relief

Plotting Earth relief

Plotting Earth relief
Plotting datetime charts

Plotting datetime charts

Plotting datetime charts
Plotting vectors

Plotting vectors

Plotting vectors
1. Making your first figure

1. Making your first figure

1. Making your first figure
2. Create a contour map

2. Create a contour map

2. Create a contour map
Azimuthal Equidistant

Azimuthal Equidistant

Azimuthal Equidistant
General Perspective

General Perspective

General Perspective
General Stereographic

General Stereographic

General Stereographic
Gnomonic

Gnomonic

Gnomonic
Lambert Azimuthal Equal Area

Lambert Azimuthal Equal Area

Lambert Azimuthal Equal Area
Orthographic

Orthographic

Orthographic
Albers Conic Equal Area

Albers Conic Equal Area

Albers Conic Equal Area
Equidistant conic

Equidistant conic

Equidistant conic
Lambert Conic Conformal Projection

Lambert Conic Conformal Projection

Lambert Conic Conformal Projection
Polyconic Projection

Polyconic Projection

Polyconic Projection
Cassini Cylindrical

Cassini Cylindrical

Cassini Cylindrical
Cylindrical Stereographic

Cylindrical Stereographic

Cylindrical Stereographic
Cylindrical equal-area

Cylindrical equal-area

Cylindrical equal-area
Cylindrical equidistant

Cylindrical equidistant

Cylindrical equidistant
Mercator

Mercator

Mercator
Miller cylindrical

Miller cylindrical

Miller cylindrical
Oblique Mercator, 1: origin and azimuth

Oblique Mercator, 1: origin and azimuth

Oblique Mercator, 1: origin and azimuth
Oblique Mercator, 2: two points

Oblique Mercator, 2: two points

Oblique Mercator, 2: two points
Oblique Mercator, 3: origin and pole

Oblique Mercator, 3: origin and pole

Oblique Mercator, 3: origin and pole
Transverse Mercator

Transverse Mercator

Transverse Mercator
Universal Transverse Mercator

Universal Transverse Mercator

Universal Transverse Mercator
Eckert IV

Eckert IV

Eckert IV
Eckert VI

Eckert VI

Eckert VI
Hammer

Hammer

Hammer
Mollweide

Mollweide

Mollweide
Robinson

Robinson

Robinson
Sinusoidal

Sinusoidal

Sinusoidal
Van der Grinten

Van der Grinten

Van der Grinten
Winkel Tripel

Winkel Tripel

Winkel Tripel
Cartesian linear

Cartesian linear

Cartesian linear
Cartesian logarithmic

Cartesian logarithmic

Cartesian logarithmic
Cartesian power

Cartesian power

Cartesian power
Polar

Polar

Polar