pygmt.Figure.tilemap
- Figure.tilemap(region, zoom='auto', source=None, lonlat=True, wait=0, max_retries=2, zoom_adjust=None, monochrome=False, no_clip=False, projection=None, frame=False, verbose=False, panel=False, transparency=None, perspective=False, **kwargs)
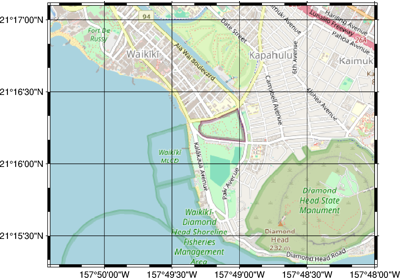
Plot an XYZ tile map.
This method loads XYZ tile maps from a tile server or local file using
pygmt.datasets.load_tile_mapinto a georeferenced form, and plots the tiles as a basemap or overlay usingpygmt.Figure.grdimage.Note: By default, standard web map tiles served in a Spherical Mercator (EPSG:3857) Cartesian format will be reprojected to a geographic coordinate reference system (OGC:CRS84) and plotted with longitude/latitude bounds when
lonlat=True. If reprojection is not desired, please setlonlat=Falseand provide Spherical Mercator (EPSG:3857) coordinates to theregionparameter.Aliases:
E = dpi
I = shading
Q = nan_transparent
B = frame
J = projection
M = monochrome
N = no_clip
V = verbose
c = panel
p = perspective
t = transparency
- Parameters:
region (
Sequence[float]) – The bounding box of the map in the form of a list [xmin, xmax, ymin, ymax]. These coordinates should be in longitude/latitude iflonlat=Trueor Spherical Mercator (EPSG:3857) iflonlat=False.zoom (
int|Literal['auto'], default:'auto') –Level of detail. Higher levels (e.g.
22) mean a zoom level closer to the Earth’s surface, with more tiles covering a smaller geographical area and thus more detail. Lower levels (e.g.0) mean a zoom level further from the Earth’s surface, with less tiles covering a larger geographical area and thus less detail. Default is"auto"to automatically determine the zoom level based on the bounding box region extent.Note
The maximum possible zoom level may be smaller than
22, and depends on what is supported by the chosen web tile provider source.source (
TileProvider|str|None, default:None) –The tile source: web tile provider or path to a local file. Provide either:
A web tile provider in the form of a
xyzservices.TileProviderobject. See Contextily providers for a list of tile providers. Default isxyzservices.providers.OpenStreetMap.HOT, i.e. OpenStreetMap Humanitarian web tiles.A web tile provider in the form of a URL. The placeholders for the XYZ in the URL need to be
{x},{y},{z}, respectively. E.g.https://{s}.tile.openstreetmap.org/{z}/{x}/{y}.png.A local file path. The file is read with rasterio and all bands are loaded into the basemap. See Working with local files.
Important
Tiles are assumed to be in the Spherical Mercator projection (EPSG:3857).
lonlat (
bool, default:True) – IfFalse, coordinates inregionare assumed to be Spherical Mercator as opposed to longitude/latitude.wait (
int, default:0) – If the tile API is rate-limited, the number of seconds to wait between a failed request and the next try.max_retries (
int, default:2) – Total number of rejected requests allowed before contextily will stop trying to fetch more tiles from a rate-limited API.zoom_adjust (
int|None, default:None) – The amount to adjust a chosen zoom level if it is chosen automatically. Values outside of -1 to 1 are not recommended as they can lead to slow execution.kwargs (dict) – Extra keyword arguments to pass to
pygmt.Figure.grdimage.