pygmt.Figure.timestamp
- Figure.timestamp(text=None, label=None, justify='BL', offset=('-54p', '-54p'), font='Helvetica,black', timefmt='%Y %b %d %H:%M:%S')
Plot the GMT timestamp logo.
Add the GMT timestamp logo with an optional label at the bottom-left corner relative to the current plot origin, with an offset of
("-54p", "-54p"). The timestamp will be in the locale set by the environment variable TZ (generally local time but can be changed viaos.environ["TZ"]) and its format is controlled by thetimefmtparameter. It can also be replaced with any custom text string using thetextparameter.- Parameters:
text (
str|None, default:None) – IfNone, the current date and time are shown in the GMT timestamp logo. Set this parameter to replace the timestamp string with a custom text string instead. The text must be no longer than 64 characters; longer strings are truncated and raise aRuntimeWarning.label (
str|None, default:None) – The text string shown after the GMT timestamp logo.justify (
Literal['TL','TC','TR','ML','MC','MR','BL','BC','BR'], default:'BL') – Specify a 2-character justification code for the timestamp box relative to the current plot origin. The default is the Bottom Left ("BL") corner.offset (
float|str|Sequence[float|str], default:('-54p', '-54p')) – offset or (offset_x, offset_y). Offset the anchor point of the timestamp box by offset_x and offset_y. If a single value offset is given, offset_y = offset_x = offset.font (
str, default:'Helvetica,black') – Font of the timestamp and the optional label. Since the GMT logo has a fixed height, the font sizes are fixed to be 8-point for the timestamp and 7-point for the label.timefmt (
str, default:'%Y %b %d %H:%M:%S') – Format string for the timestamp. The format string is parsed by the C functionstrftime, so that virtually any text can be used (even not containing any time information).
Examples
Plot the GMT timestamp logo.
>>> import pygmt
>>> fig = pygmt.Figure()
>>> fig.timestamp()
>>> fig.show()
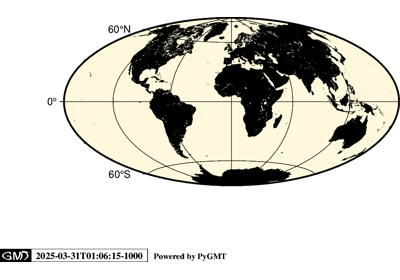
Plot the GMT timestamp logo with a custom label.
>>> fig = pygmt.Figure()
>>> fig.timestamp(label="Powered by PyGMT")
>>> fig.show()