Note
Click here to download the full example code
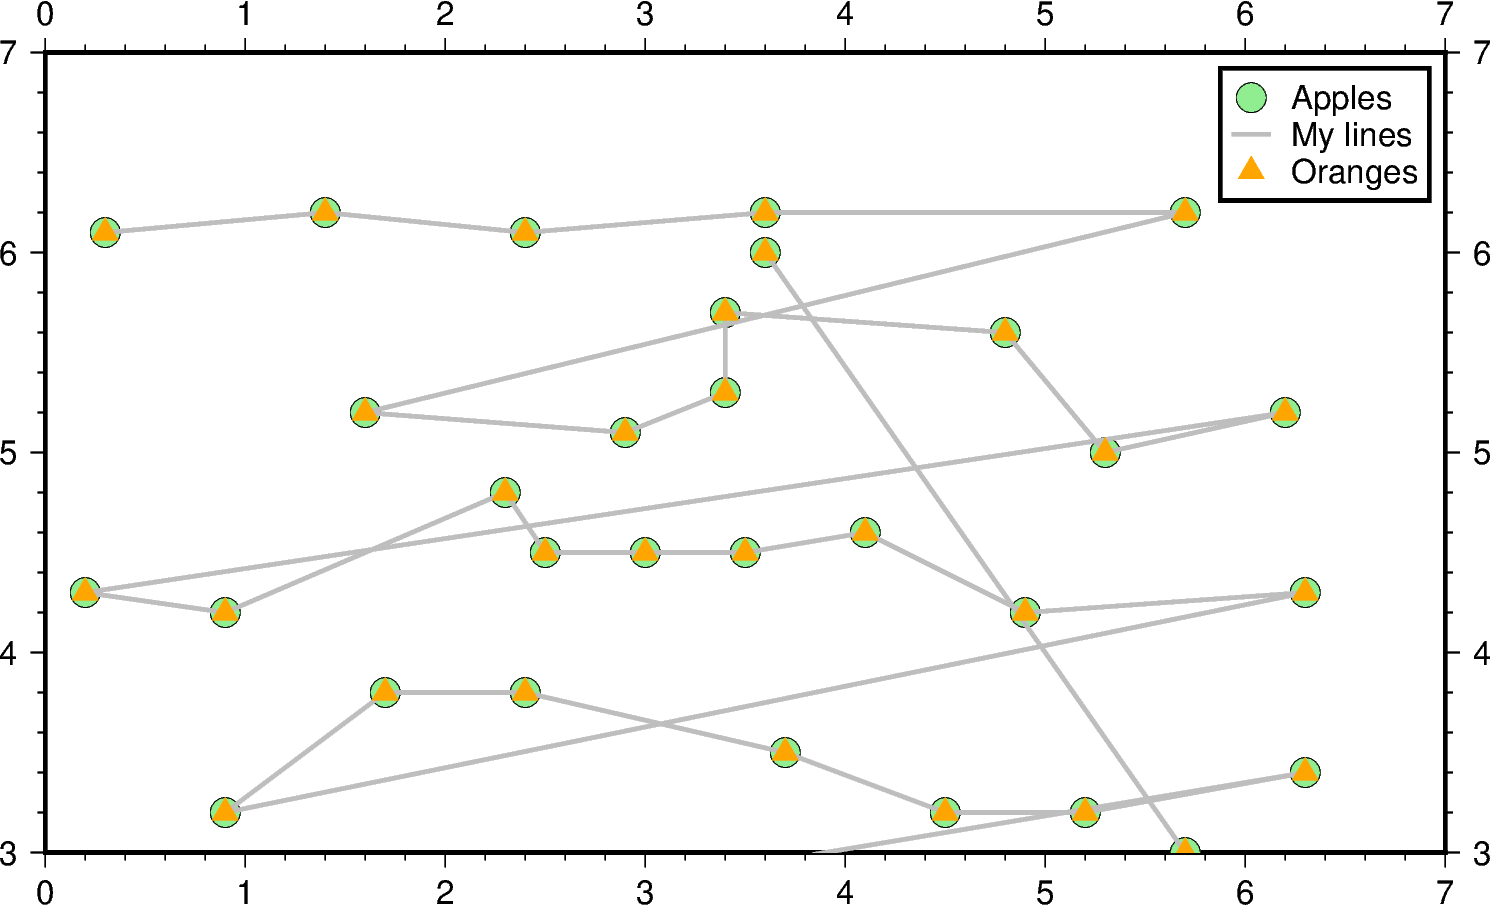
Legend
The pygmt.Figure.legend method can automatically create a legend for
symbols plotted using pygmt.Figure.plot. Legend entries are only
created when the label parameter is used.
Out:
<IPython.core.display.Image object>
import pygmt

fig = pygmt.Figure()

fig.basemap(projection="x1i", region=[0, 7, 3, 7], frame=True)

fig.plot(
    data="@Table_5_11.txt",
    style="c0.15i",
    color="lightgreen",
    pen="faint",
    label="Apples",
)
fig.plot(data="@Table_5_11.txt", pen="1.5p,gray", label='"My lines"')
fig.plot(data="@Table_5_11.txt", style="t0.15i", color="orange", label="Oranges")

fig.legend(position="JTR+jTR+o0.2c", box=True)

fig.show()
Total running time of the script: ( 0 minutes 1.840 seconds)