Note
Click here to download the full example code
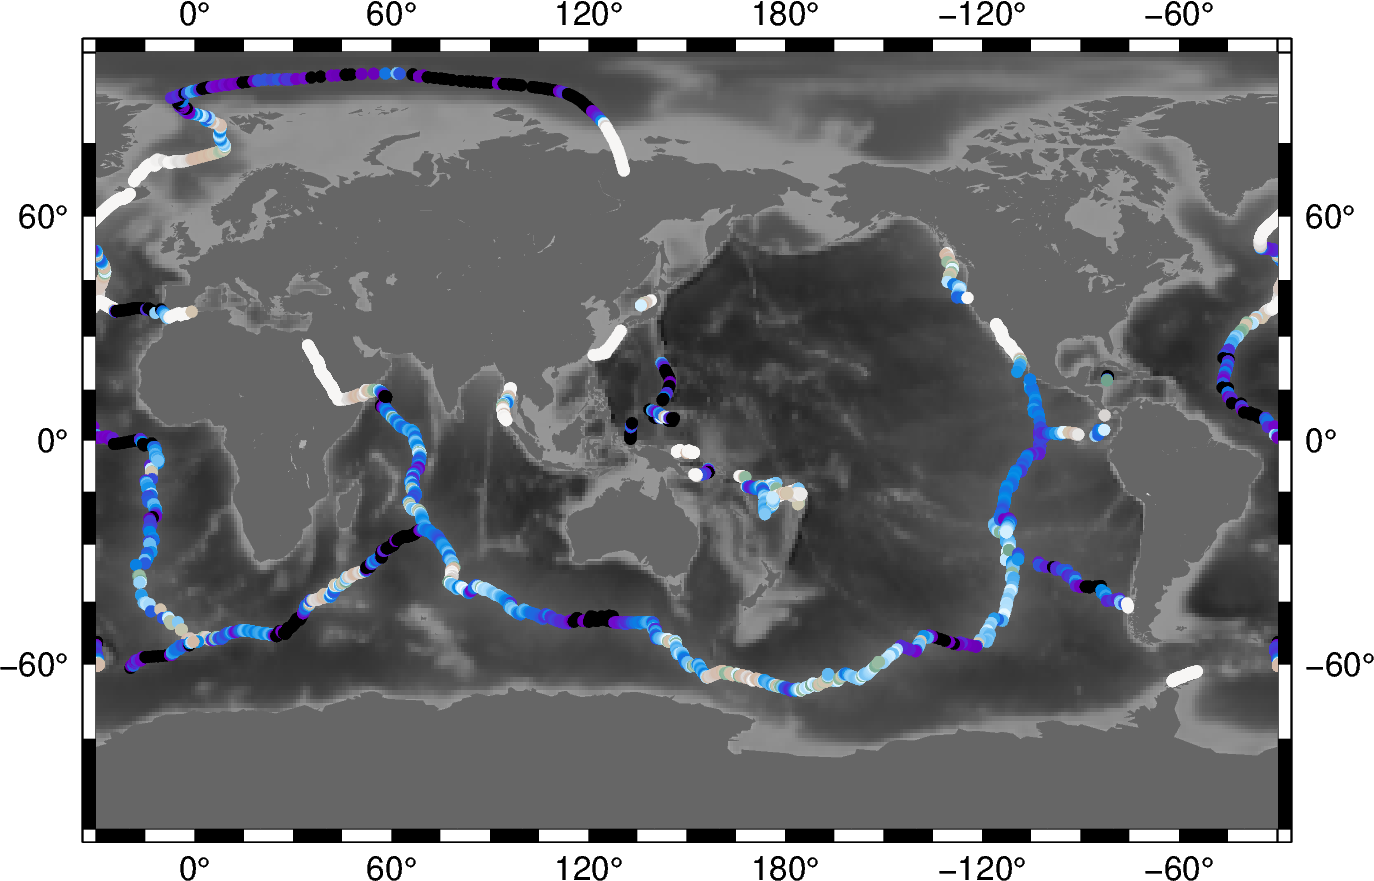
Sampling along tracks
The pygmt.grdtrack function samples a raster grid’s value along specified
points. We will need to input a 2D raster to grid which can be an
xarray.DataArray. The argument passed to the points parameter can be a
pandas.DataFrame table where the first two columns are x and y (or longitude
and latitude). Note also that there is a newcolname parameter that will be used to
name the new column of values sampled from the grid.
Alternatively, a NetCDF file path can be passed to grid. An ASCII file path can
also be accepted for points. To save an output ASCII file, a file name argument
needs to be passed to the outfile parameter.
Out:
<IPython.core.display.Image object>
import pygmt

# Load sample grid and point datasets
grid = pygmt.datasets.load_earth_relief()
points = pygmt.datasets.load_ocean_ridge_points()
# Sample the bathymetry along the world's ocean ridges at specified track points
track = pygmt.grdtrack(points=points, grid=grid, newcolname="bathymetry")

fig = pygmt.Figure()
# Plot the earth relief grid on Cylindrical Stereographic projection, masking land areas
fig.basemap(region="g", projection="Cyl_stere/150/-20/15c", frame=True)
fig.grdimage(grid=grid, cmap="gray")
fig.coast(land="#666666")
# Plot the sampled bathymetry points using circles (c) of 0.15 cm
# Points are colored using elevation values (normalized for visual purposes)
fig.plot(
    x=track.longitude,
    y=track.latitude,
    style="c0.15c",
    cmap="terra",
    color=(track.bathymetry - track.bathymetry.mean()) / track.bathymetry.std(),
)
fig.show()
Total running time of the script: ( 0 minutes 2.522 seconds)