Note
Click here to download the full example code
Making your first figure
Welcome to PyGMT! Here we’ll cover some of basic concepts, like creating simple figures and naming conventions.
Loading the library
All modules and figure generation is accessible from the pygmt top level
package:
import pygmt
Creating figures
All figure generation in PyGMT is handled by the pygmt.Figure class.
Start a new figure by creating an instance of this class:
fig = pygmt.Figure()
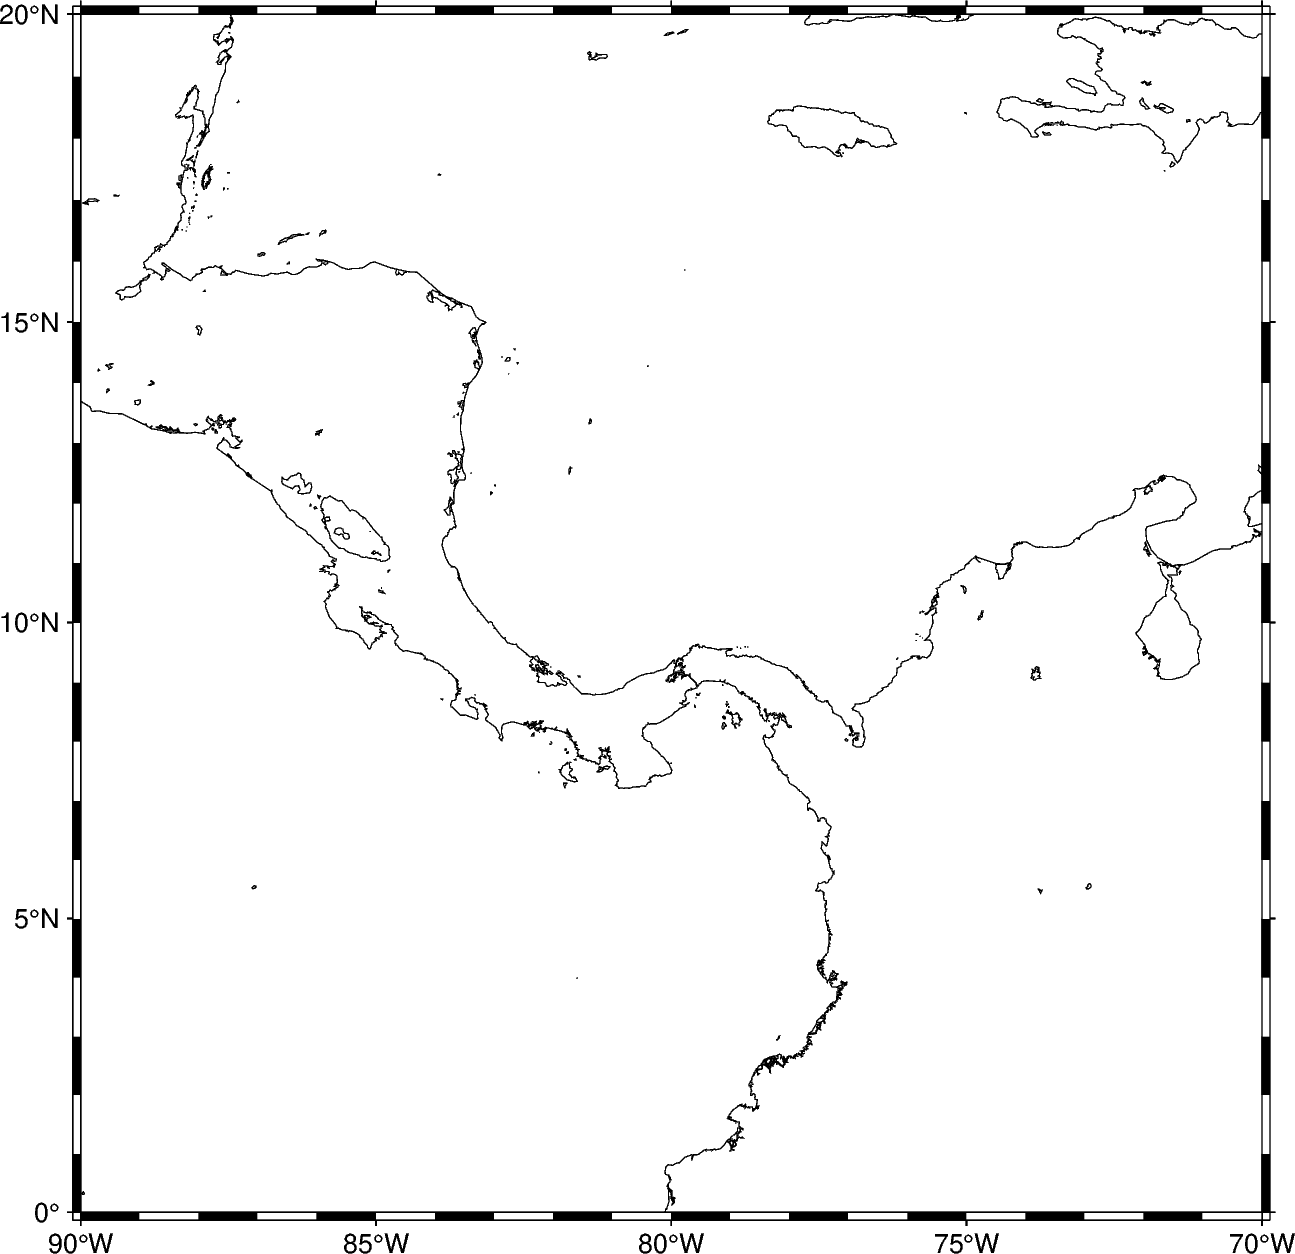
Add elements to the figure using its methods. For example, let’s use
pygmt.Figure.basemap to start the creation of a map. We’ll use the region parameter
to provide the longitude and latitude bounds, the projection parameter to set
the projection to Mercator (M) and the map width to 15 cm, and the frame
parameter to generate a frame with automatic tick and annotation spacings.
fig.basemap(region=[-90, -70, 0, 20], projection="M15c", frame=True)
Now we can add coastlines using pygmt.Figure.coast to this map using the
default resolution, line width, and color:
fig.coast(shorelines=True)
To see the figure, call pygmt.Figure.show:
fig.show()
Out:
<IPython.core.display.Image object>
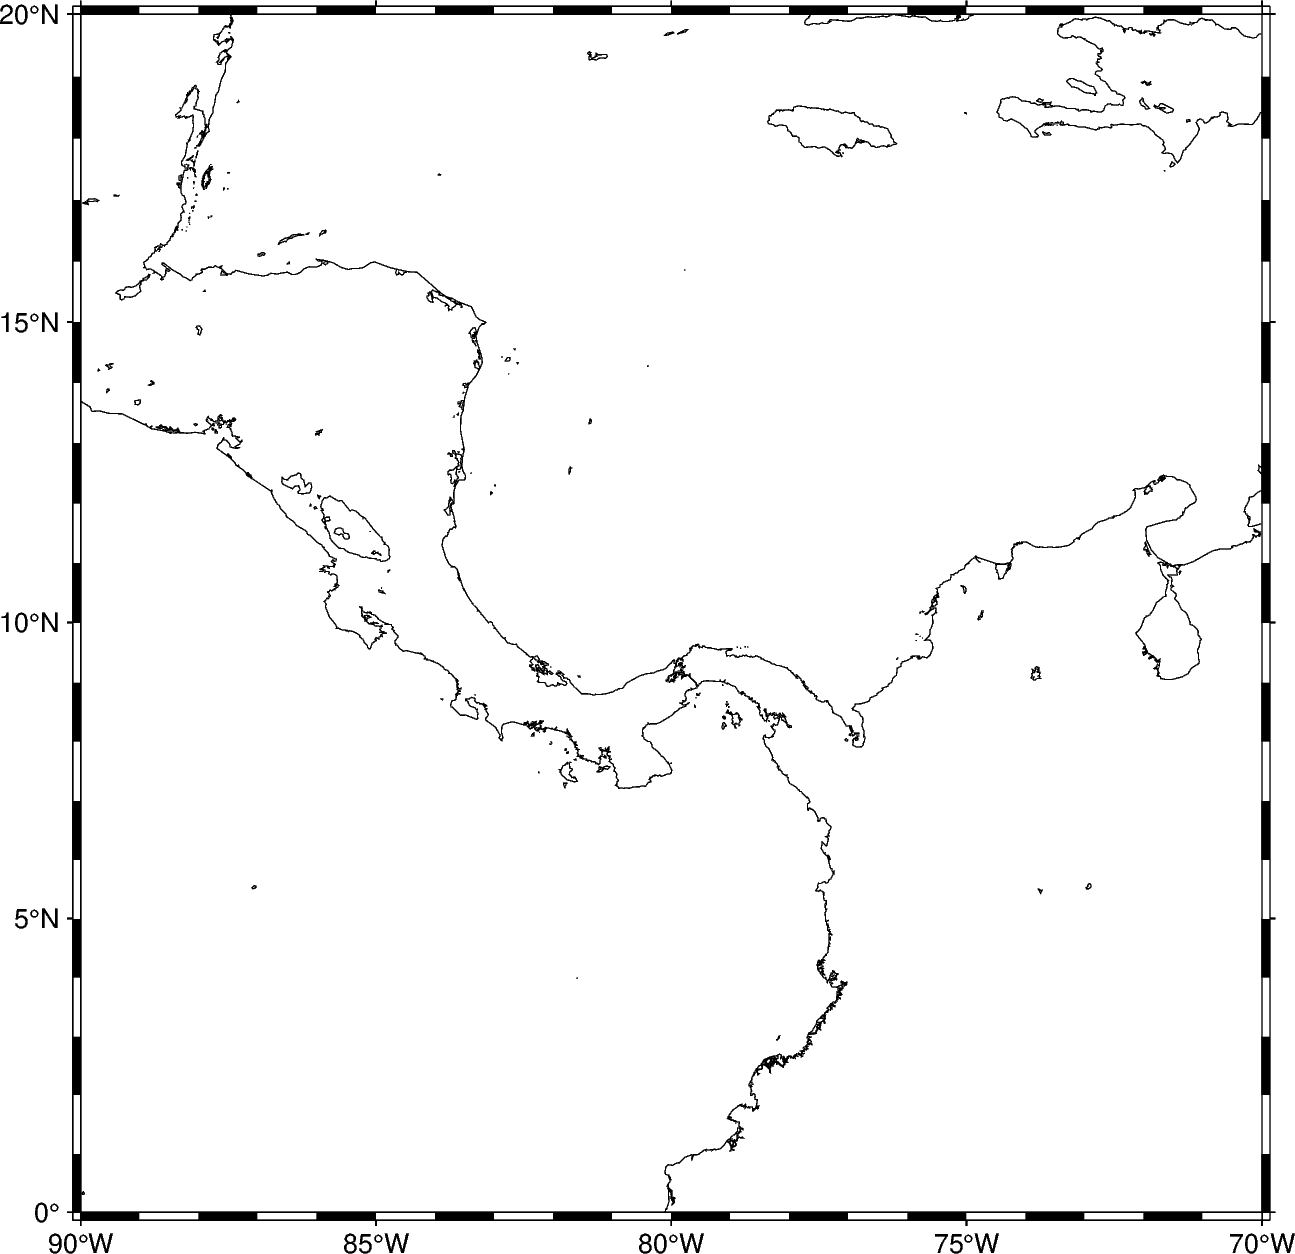
You can also set the map region, projection, and frame type directly in other methods
without calling gmt.Figure.basemap:
fig = pygmt.Figure()
fig.coast(shorelines=True, region=[-90, -70, 0, 20], projection="M15c", frame=True)
fig.show()
Out:
<IPython.core.display.Image object>
Saving figures
Use the method pygmt.Figure.savefig to save your figure to a file. The figure
format is inferred from the extension.
fig.savefig("central-america-shorelines.png")
Note for experienced GMT users
You have probably noticed several things that are different from classic command-line GMT. Many of these changes reflect the new GMT modern execution mode that is part of GMT 6.
As a general rule, the
psprefix has been removed from allps*modules (PyGMT methods). For example, the name of the GMT 5 modulepscoastiscoastin GMT 6 and PyGMT. The exceptions are:psxywhich is nowplot,psxyzwhich is nowplot3d, andpsscalewhich is nowcolorbar.More details can be found in the GMT cookbook introduction to modern mode.
A few are PyGMT exclusive (like the savefig method).
The PyGMT parameters (called options or arguments in GMT) don’t use the GMT 1-letter syntax (R, J, B, etc). We use longer aliases for these parameters and have some Python exclusive names. The mapping between the GMT parameters and their PyGMT aliases should be straightforward. For some modules, these aliases are still being developed.
Parameters like
regioncan takelistsas well as strings like1/2/3/4.If a GMT option has no arguments (like
-Binstead of-Baf), use aTruein Python. An empty string would also be acceptable. For repeated parameters, such as-B+Loleron -Bxaf -By+lm, provide alist:frame=["+Loleron", "xaf", "y+lm"].There is no output redirecting to a PostScript file. The figure is generated in the background and will only be shown or saved when you ask for it.
Total running time of the script: ( 0 minutes 2.431 seconds)