Note
Click here to download the full example code
Setting the region
Many of the plotting functions take the region parameter, which sets
the area that will be shown in the figure. This tutorial covers the different types of
inputs that it can accept.
import pygmt
Coordinates
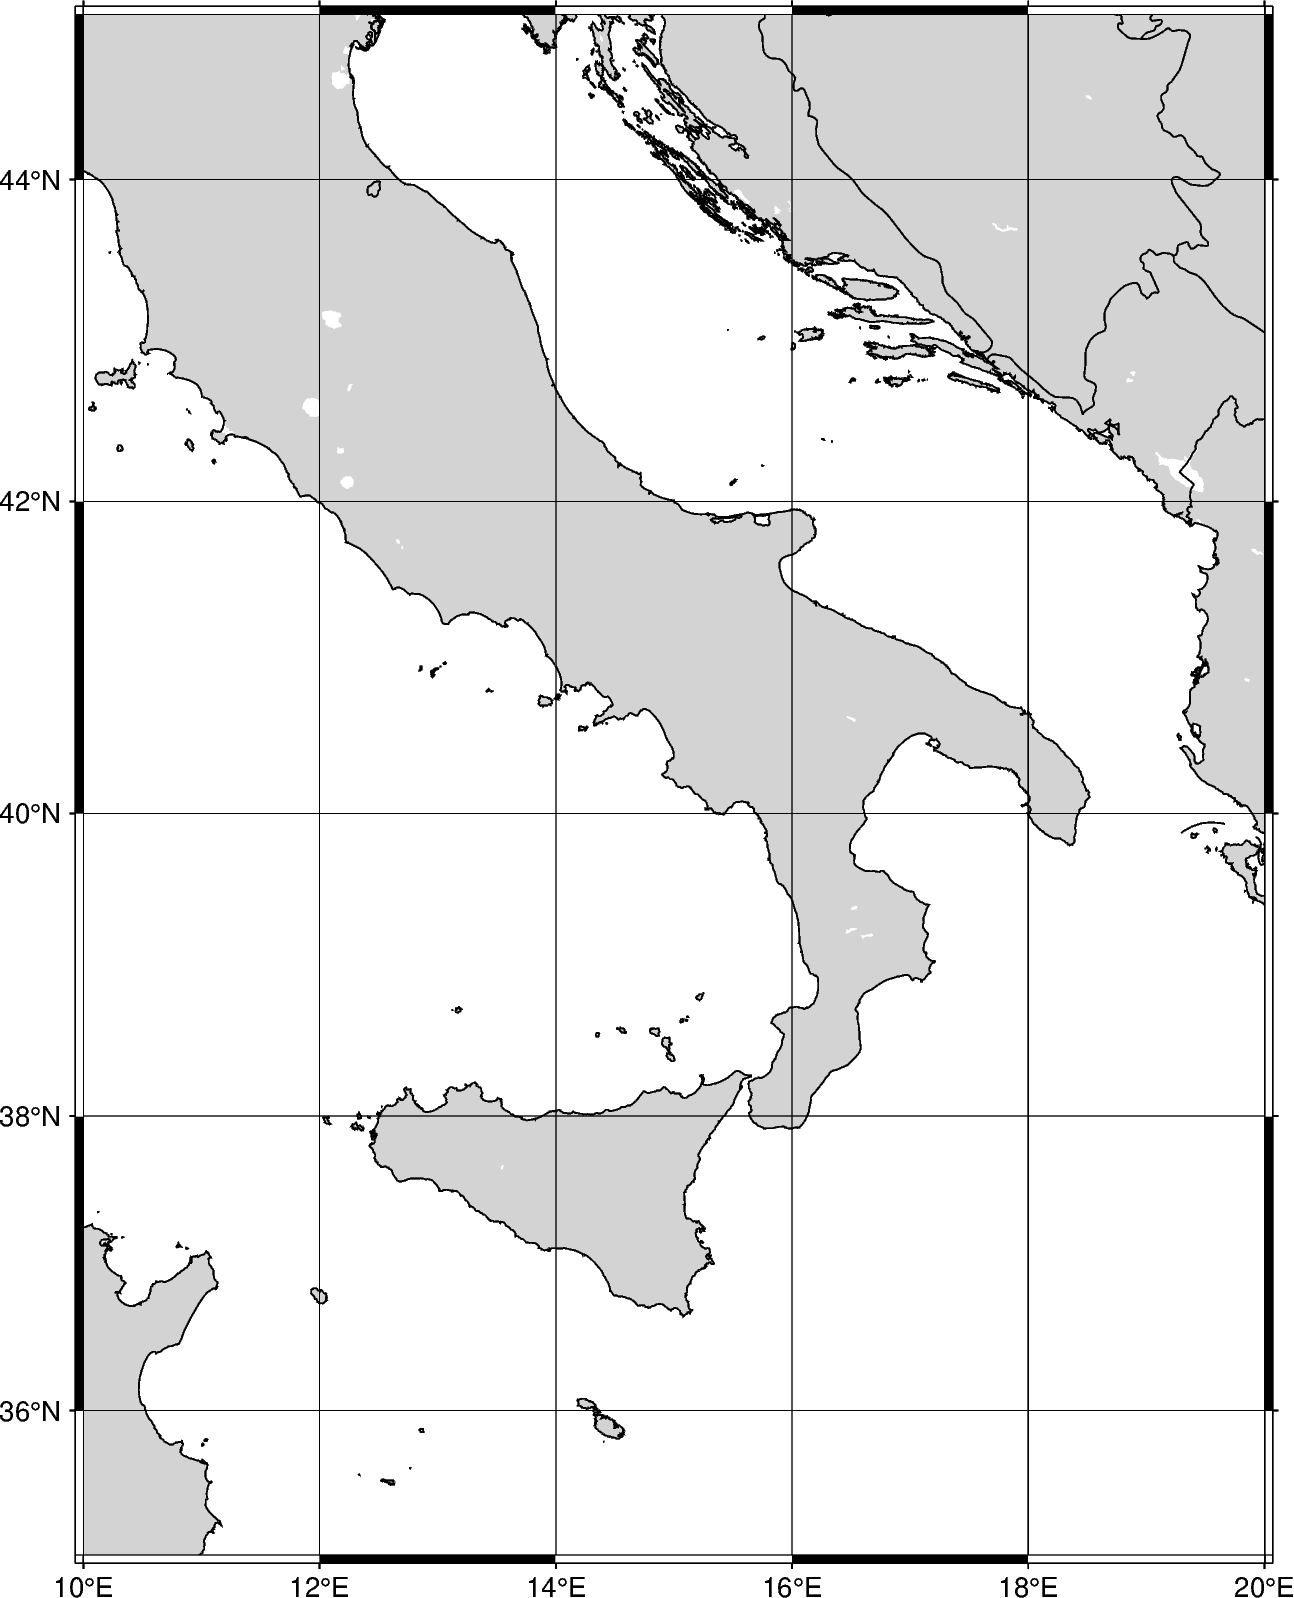
A string of coordinates can be passed to region, in the form of
xmin/xmax/ymin/ymax.
fig = pygmt.Figure()
fig.coast(
    # Set the x-range from 10E to 20E and the y-range to 35N to 45N
    region="10/20/35/45",
    # Set projection to Mercator, and the figure size to 15 centimeters
    projection="M15c",
    # Set the color of the land to light gray
    land="lightgray",
    # Set the color of the water to white
    water="white",
    # Display the national borders and set the pen thickness to 0.5p
    borders="1/0.5p",
    # Display the shorelines and set the pen thickness to 0.5p
    shorelines="1/0.5p",
    # Set the frame to display annotations and gridlines
    frame="ag",
)
fig.show()
Out:
<IPython.core.display.Image object>
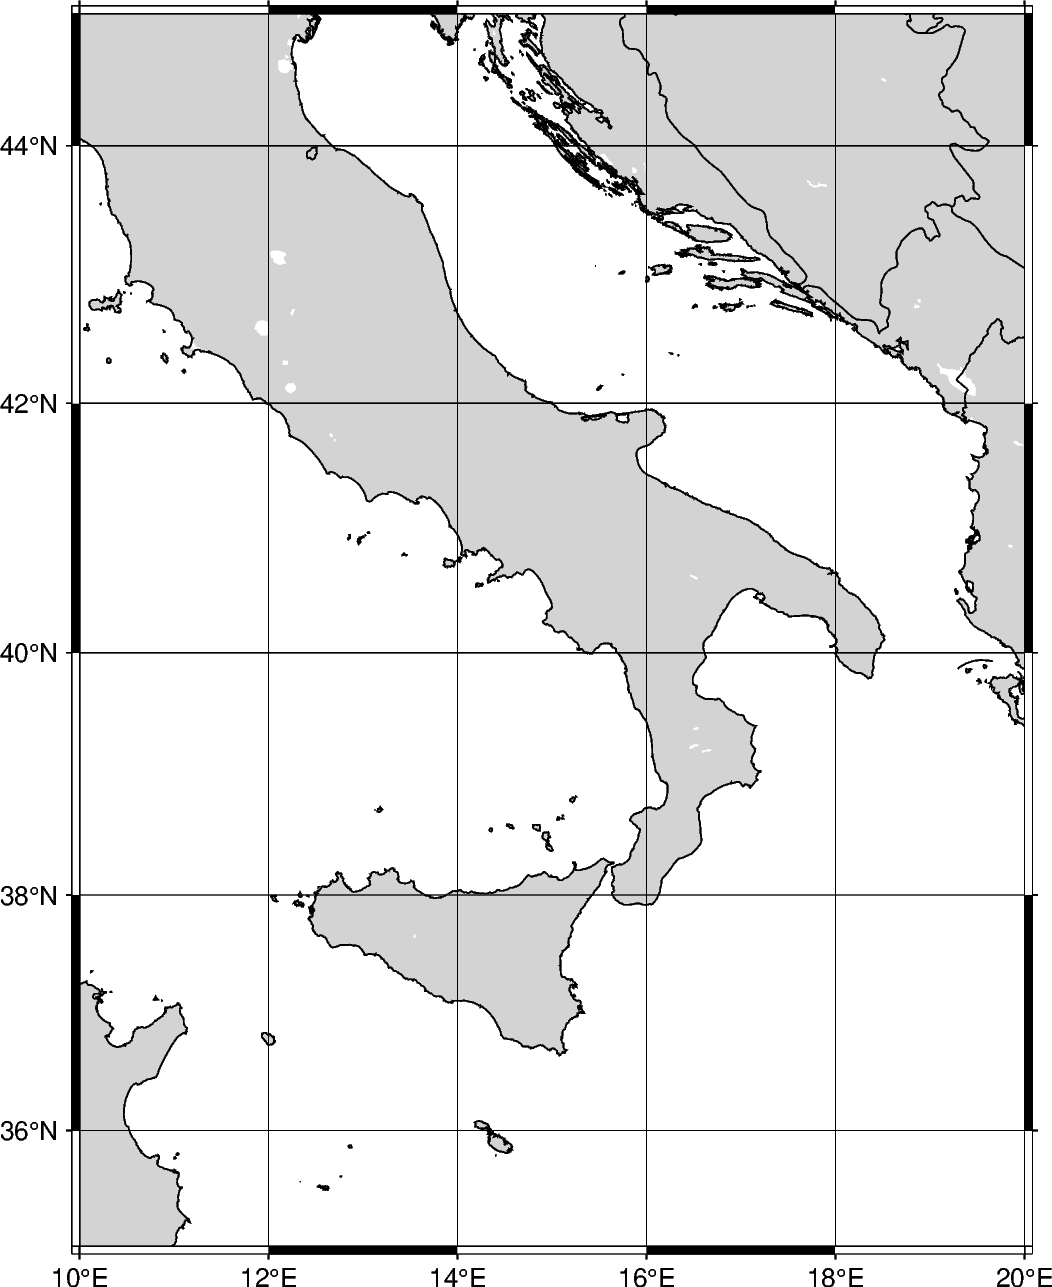
The coordinates can be passed to region as a list, in the form of
[xmin,xmax,ymin,ymax].
fig = pygmt.Figure()
fig.coast(
    # Set the x-range from 10E to 20E and the y-range to 35N to 45N
    region=[10, 20, 35, 45],
    projection="M12c",
    land="lightgray",
    water="white",
    borders="1/0.5p",
    shorelines="1/0.5p",
    frame="ag",
)
fig.show()
Out:
<IPython.core.display.Image object>
Instead of passing axes minima and maxima, the coordinates can be passed for the
bottom-left and top-right corners. The string format takes the coordinates for the
bottom-left and top-right coordinates. To specify corner coordinates, append +r
at the end of the region string.
fig = pygmt.Figure()
fig.coast(
    # Set the bottom-left corner as 10E, 35N and the top-right corner as 20E, 45N
    region="10/35/20/45+r",
    projection="M12c",
    land="lightgray",
    water="white",
    borders="1/0.5p",
    shorelines="1/0.5p",
    frame="ag",
)
fig.show()

Out:
<IPython.core.display.Image object>
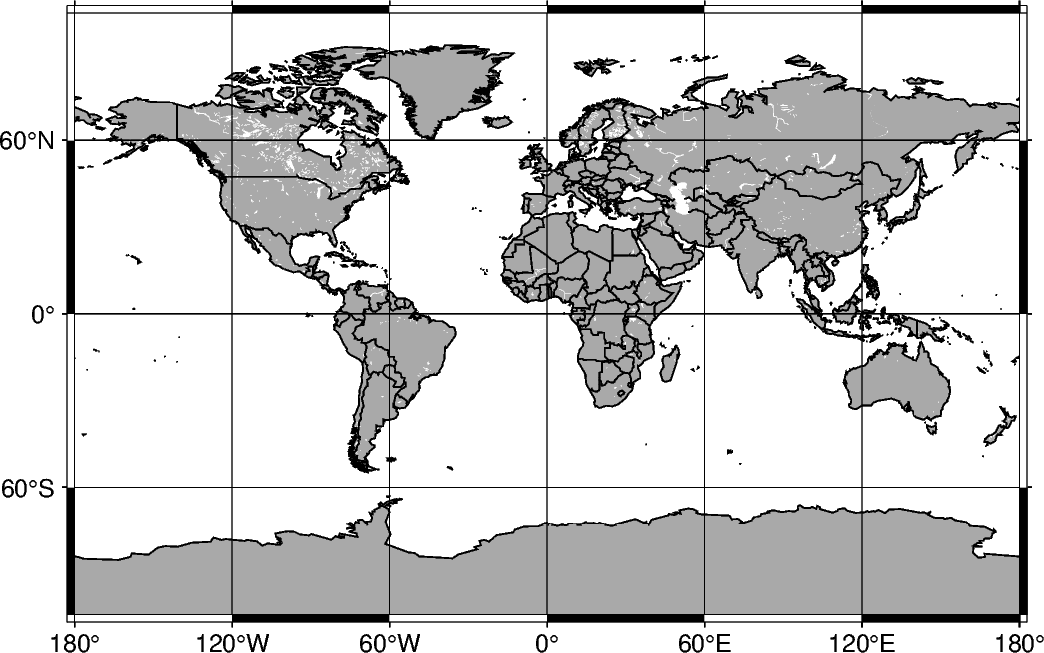
Global regions
In addition to passing coordinates, the argument d can be passed to set the region to the entire globe. The range is 180W to 180E (-180, 180) and 90S to 90N (-90 to 90). With no parameters set for the projection, the figure defaults to be centered at the mid-point of both x- and y-axes. Using d, the figure is centered at (0, 0), or the intersection of the equator and prime meridian.
fig = pygmt.Figure()
fig.coast(
    region="d",
    projection="Cyl_stere/12c",
    land="darkgray",
    water="white",
    borders="1/0.5p",
    shorelines="1/0.5p",
    frame="ag",
)
fig.show()
Out:
<IPython.core.display.Image object>
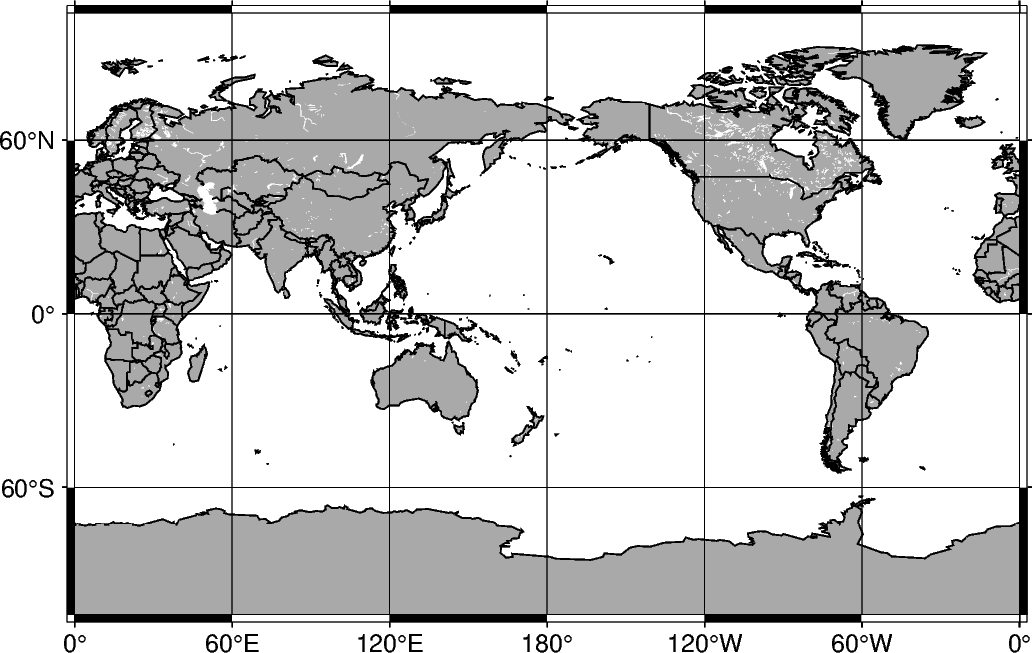
The argument g can be passed, which encompasses the entire globe. The range is 0E to 360E (0, 360) and 90S to 90N (-90 to 90). With no parameters set for the projection, the figure is centered at (180, 0), or the intersection of the equator and International Date Line.
fig = pygmt.Figure()
fig.coast(
    region="g",
    projection="Cyl_stere/12c",
    land="darkgray",
    water="white",
    borders="1/0.5p",
    shorelines="1/0.5p",
    frame="ag",
)
fig.show()
Out:
<IPython.core.display.Image object>
ISO code
The region can be set to include a specific area specified by the two-character
ISO 3166-1 alpha-2 convention
(for further information: https://en.wikipedia.org/wiki/ISO_3166-1_alpha-2).
fig = pygmt.Figure()
fig.coast(
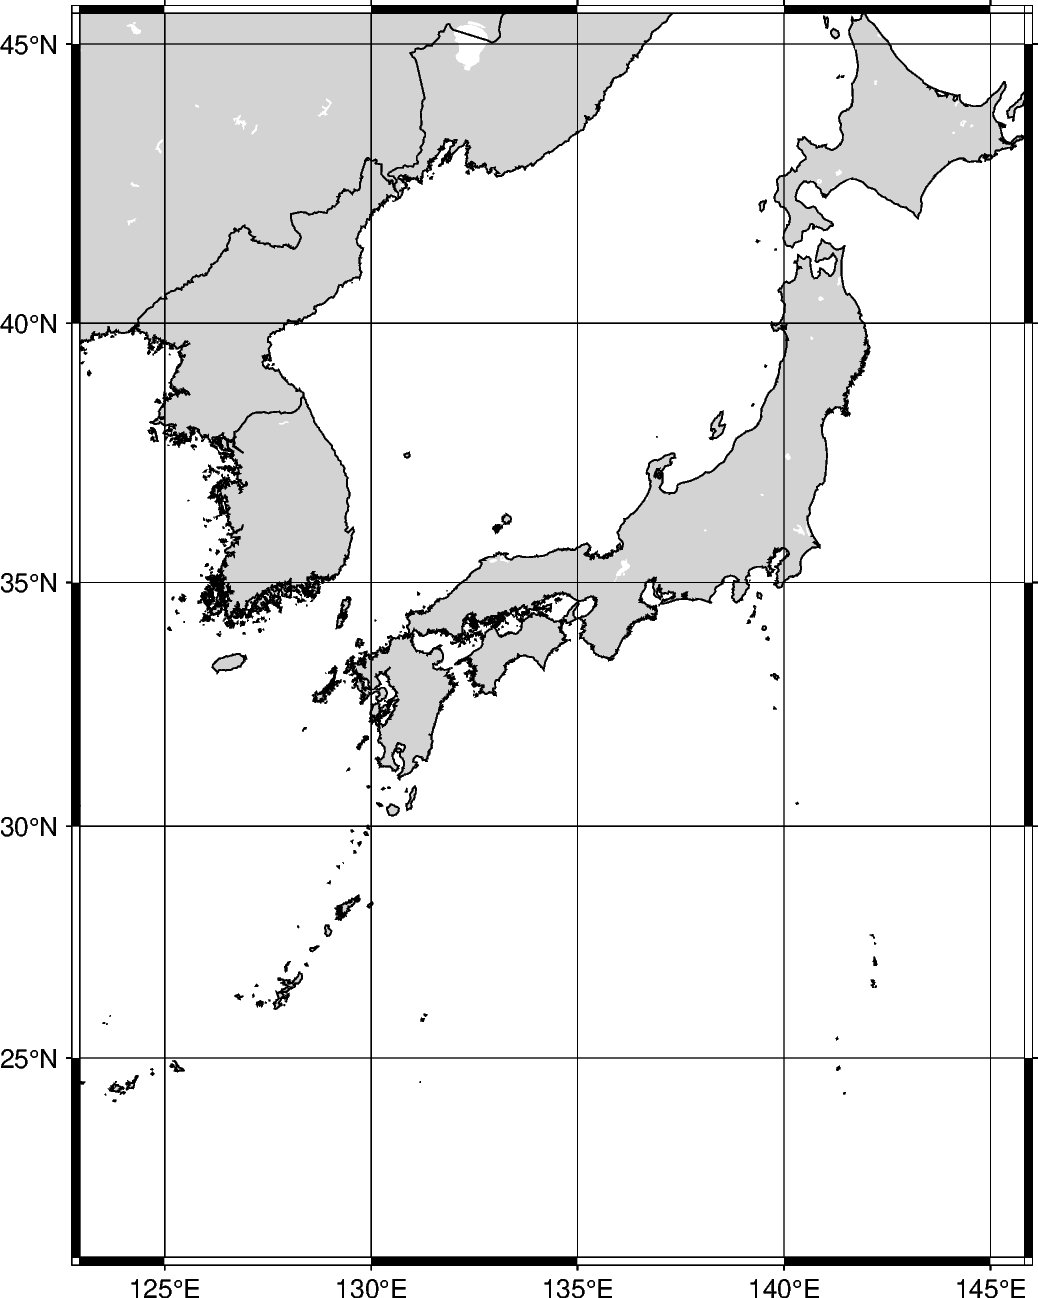
# Set the figure region to encompass Japan with the ISO code "JP"
region="JP",
projection="M12c",
land="lightgray",
water="white",
borders="1/0.5p",
shorelines="1/0.5p",
frame="ag",
)
fig.show()
Out:
<IPython.core.display.Image object>
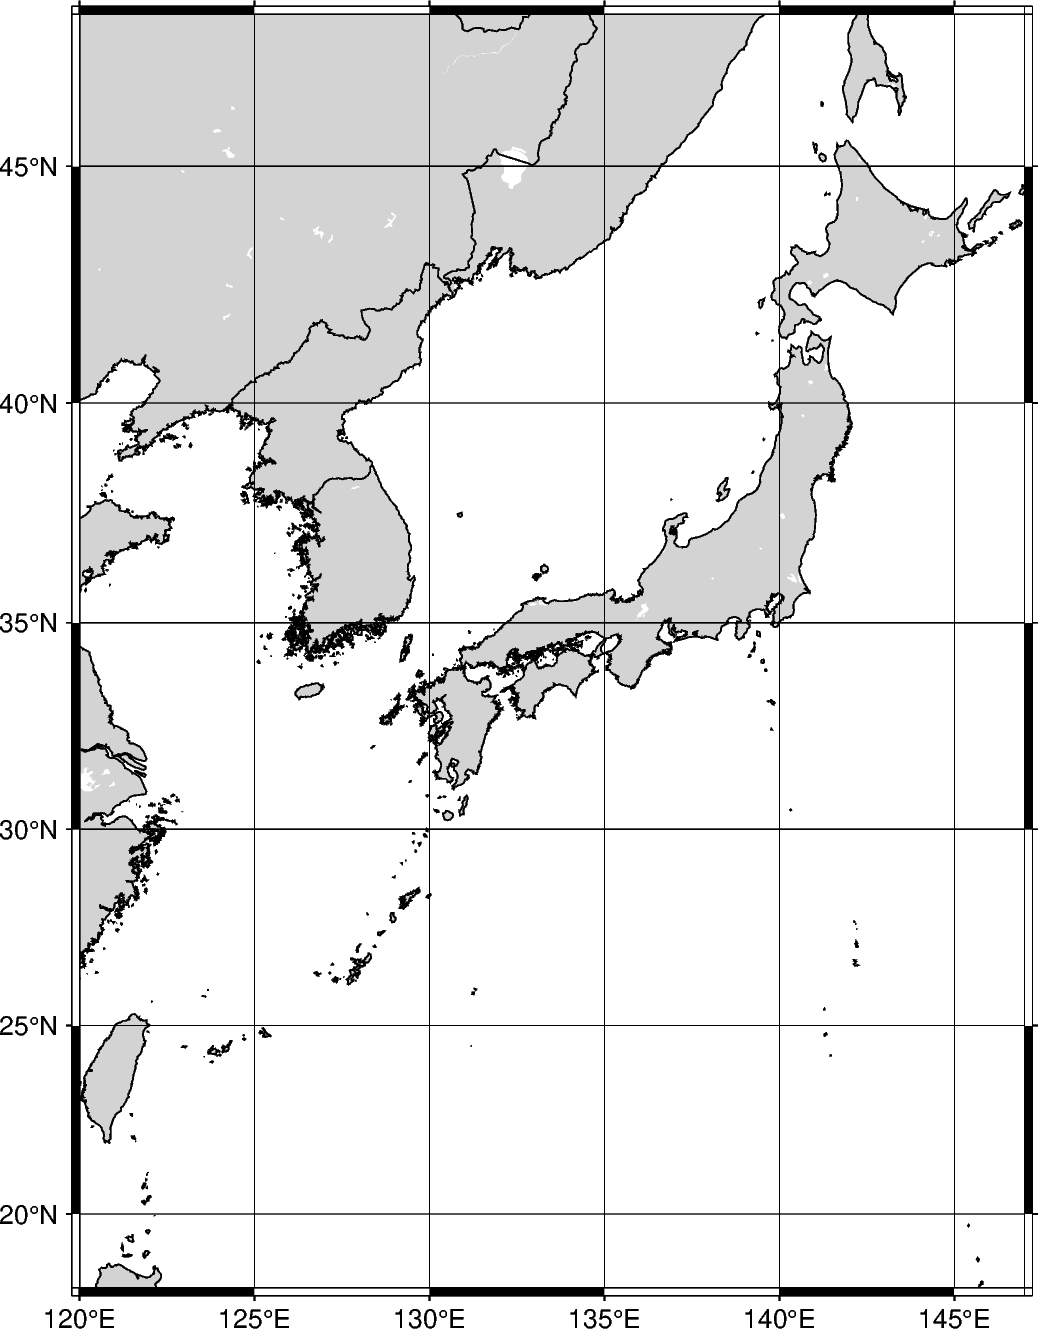
The area encompassed by the ISO code can be expanded by appending +rincrement to the ISO code. The increment unit is in degrees, and if only one value is added it expands the range of the region in all directions. Using +r expands the final region boundaries to be multiples of increment .
fig = pygmt.Figure()
fig.coast(
    # Expand the region boundaries to be multiples of 3 degrees in all directions
    region="JP+r3",
    projection="M12c",
    land="lightgray",
    water="white",
    borders="1/0.5p",
    shorelines="1/0.5p",
    frame="ag",
)
fig.show()

Out:
<IPython.core.display.Image object>
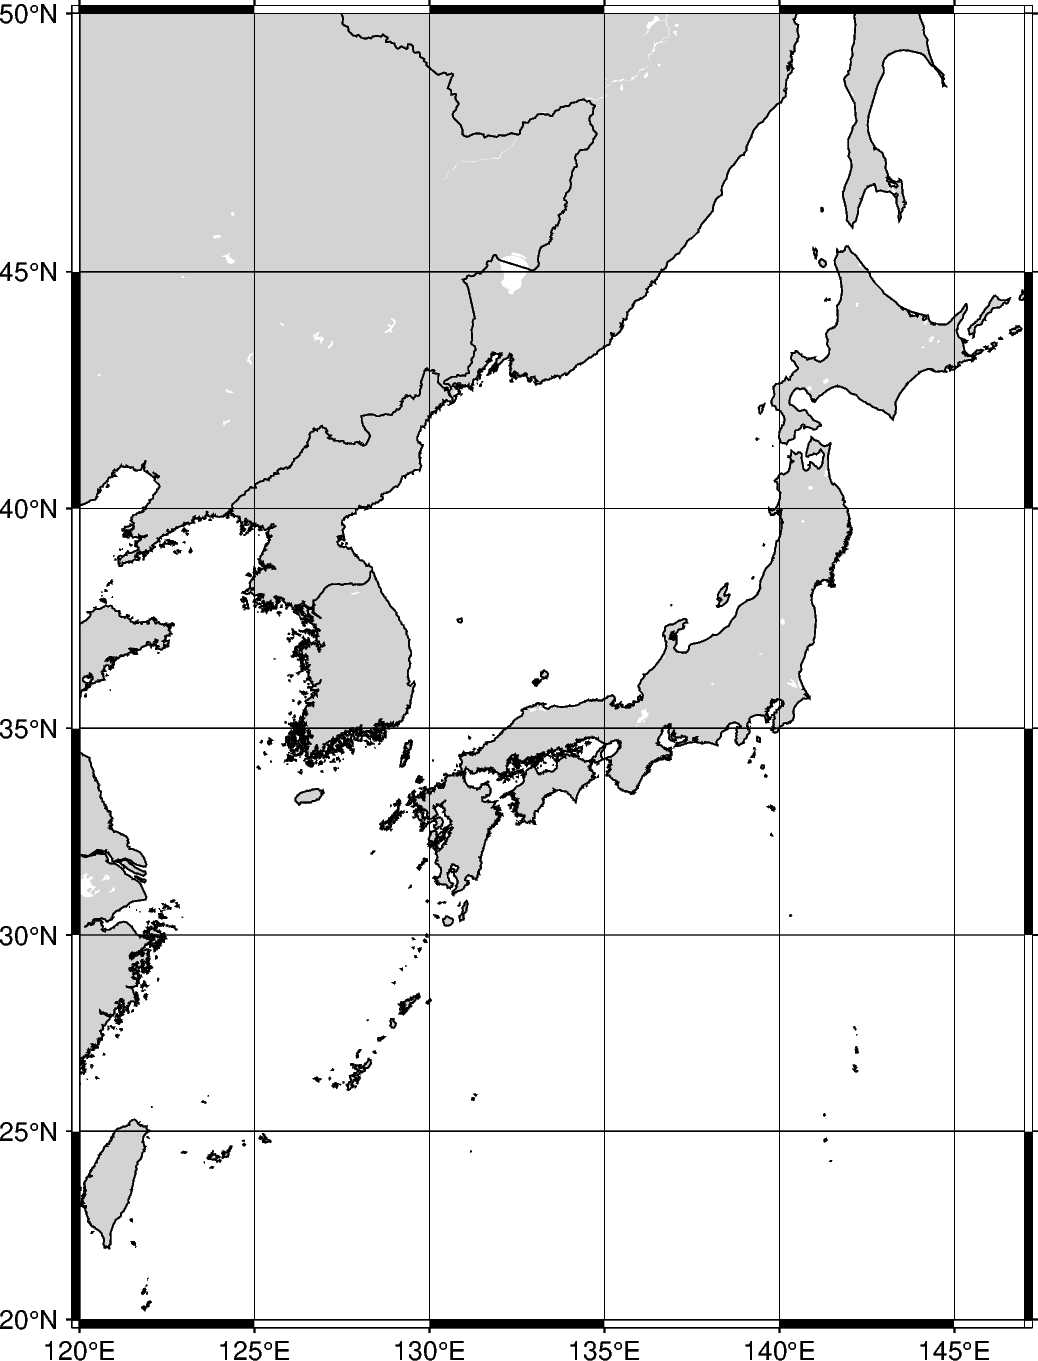
Instead of expanding the range of the plot uniformly in all directions, two values can be passed to expand differently on each axis. The format is xinc/yinc.
fig = pygmt.Figure()
fig.coast(
    # Expand the region boundaries to be multiples of 3 degrees on the x-axis
    # and 5 degrees on the y-axis.
    region="JP+r3/5",
    projection="M12c",
    land="lightgray",
    water="white",
    borders="1/0.5p",
    shorelines="1/0.5p",
    frame="ag",
)
fig.show()
Out:
<IPython.core.display.Image object>
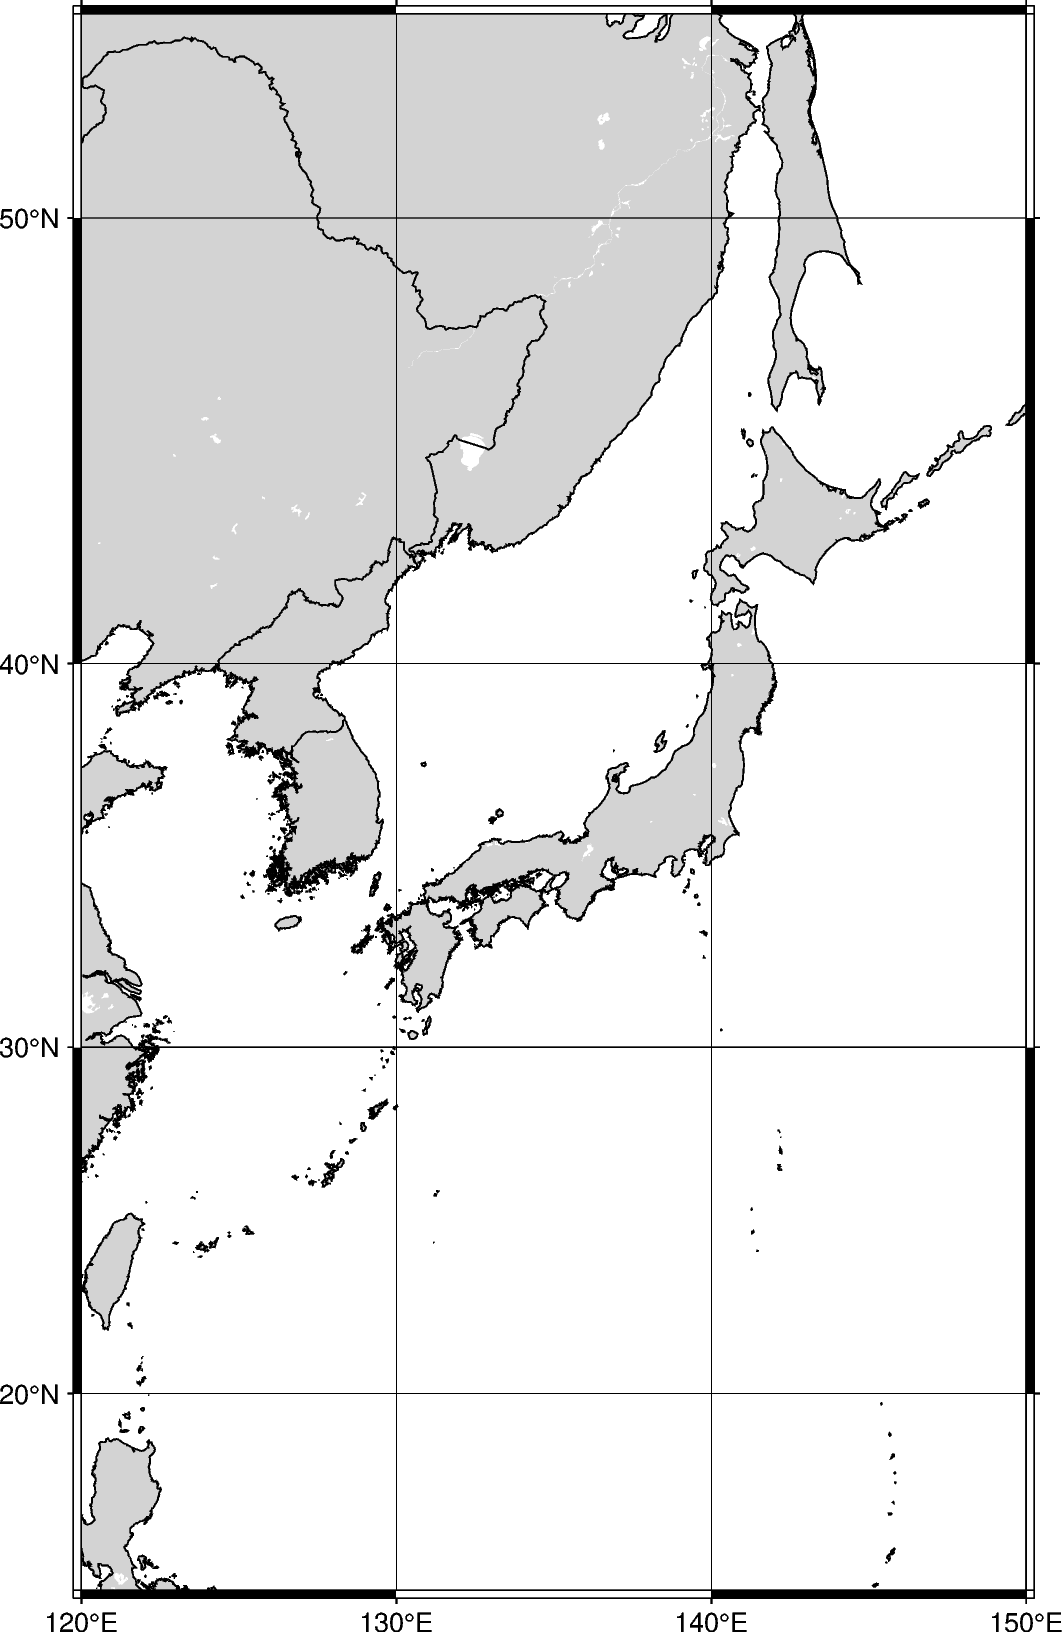
Instead of expanding the range of the plot uniformly in all directions, four values can be passed to expand differently in each direction. The format is winc/einc/sinc/ninc, which expands on the west, east, south, and north axes.
fig = pygmt.Figure()
fig.coast(
    # Expand the region boundaries to be multiples of 3 degrees to the west,
    # 5 degrees to the east, 7 degrees to the south, and 9 degrees to the north.
    region="JP+r3/5/7/9",
    projection="M12c",
    land="lightgray",
    water="white",
    borders="1/0.5p",
    shorelines="1/0.5p",
    frame="ag",
)
fig.show()
Out:
<IPython.core.display.Image object>
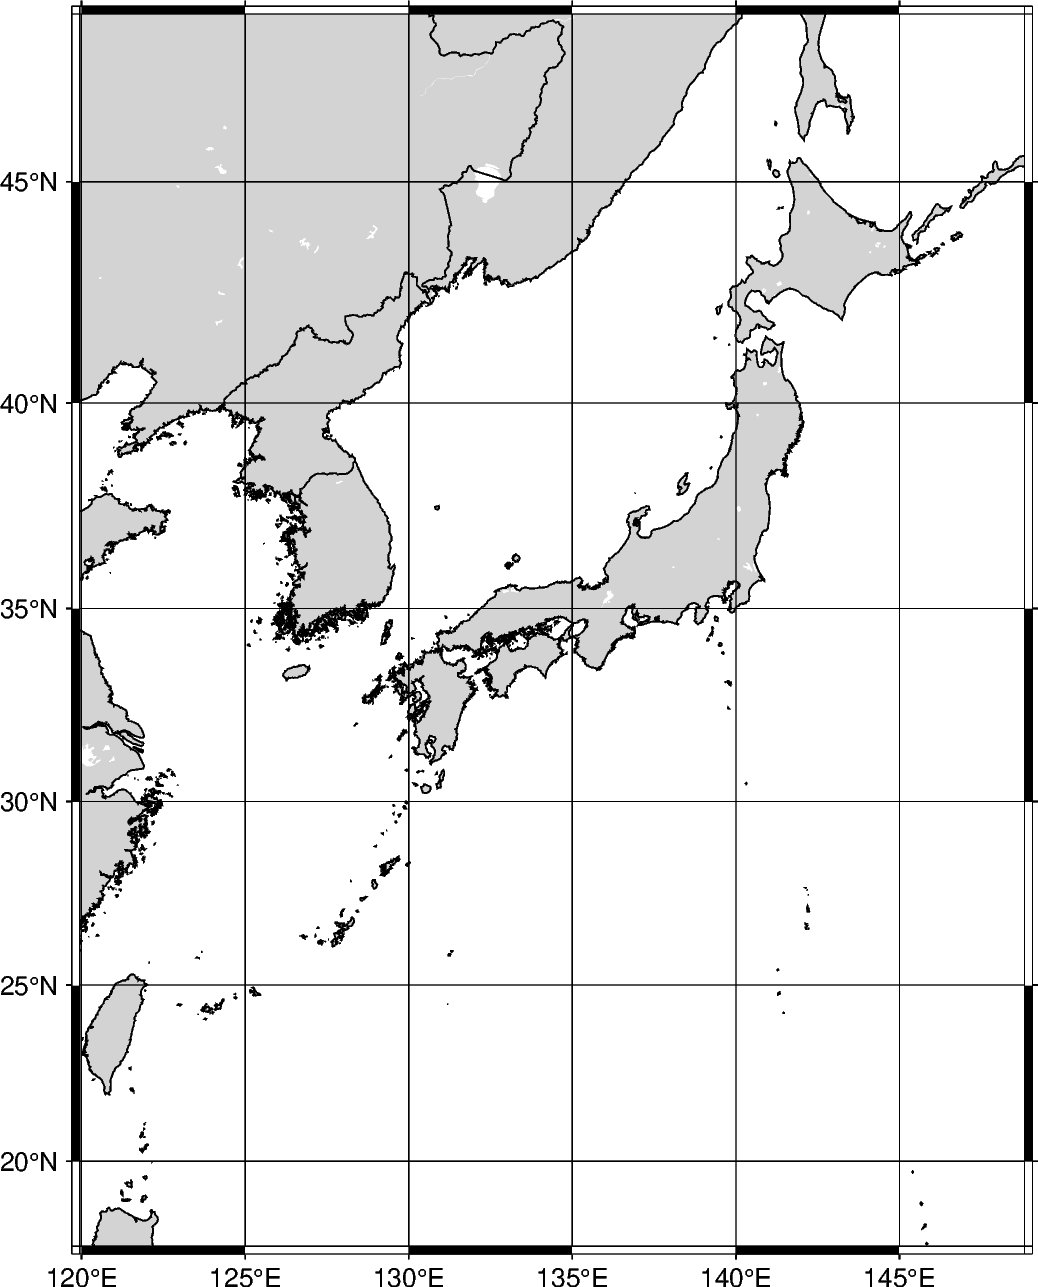
The region increment can be appended with +R, which adds the increment
without rounding.
fig = pygmt.Figure()
fig.coast(
    # Expand the region setting outside the range of Japan by 3 degrees in all
    # directions, without rounding to the nearest increment.
    region="JP+R3",
    projection="M12c",
    land="lightgray",
    water="white",
    borders="1/0.5p",
    shorelines="1/0.5p",
    frame="ag",
)
fig.show()
Out:
<IPython.core.display.Image object>
The region increment can be appended with +e, which is like +r and
expands the final region boundaries to be multiples of increment. However,
it ensures that the bounding box extends by at least 0.25 times the increment.
fig = pygmt.Figure()
fig.coast(
    # Expand the region boundaries to be multiples of 3 degrees in all directions
    region="JP+e3",
    projection="M12c",
    land="lightgray",
    water="white",
    borders="1/0.5p",
    shorelines="1/0.5p",
    frame="ag",
)
fig.show()
Out:
<IPython.core.display.Image object>
Total running time of the script: ( 0 minutes 15.843 seconds)