Note
Click here to download the full example code
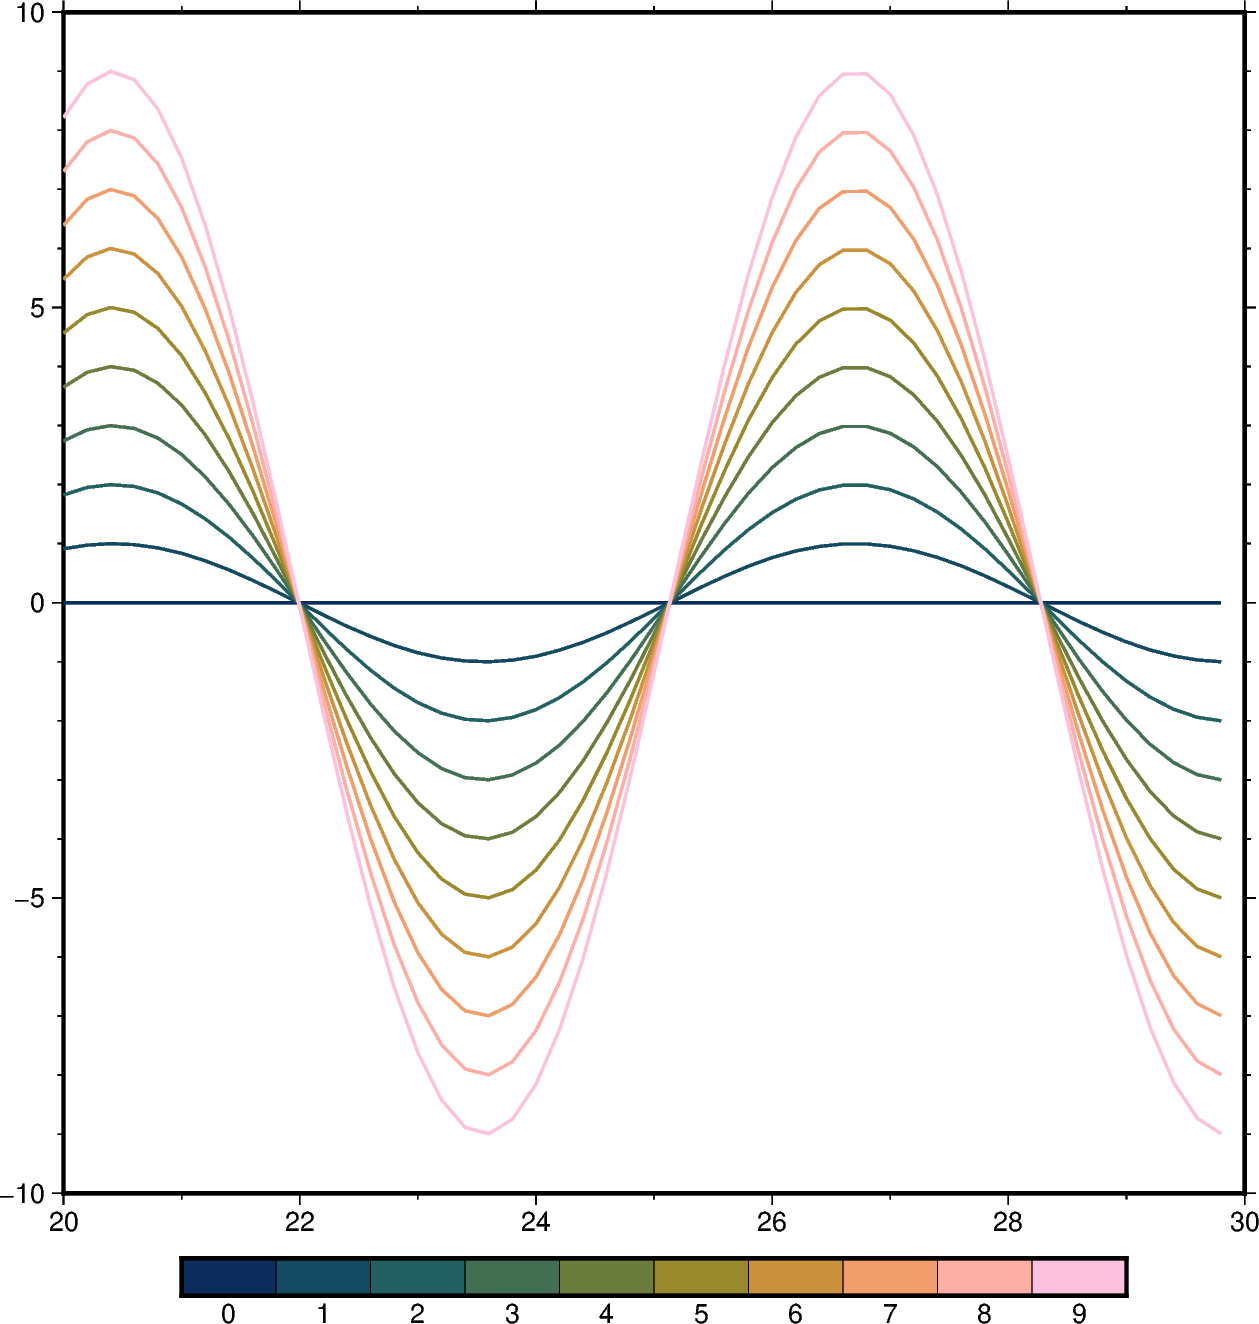
Line colors with a custom CPT
The color of the lines made by pygmt.Figure.plot can be set according
to a custom CPT and assigned with the pen parameter.
The custom CPT can be used by setting the plot command’s cmap parameter to
True. The zvalue parameter sets the z-value (color) to be used from the
custom CPT, and the line color is set as the z-value by using +z when
setting the pen color.
Out:
<IPython.core.display.Image object>
import numpy as np
import pygmt

# Create a list of values between 20 and 30 with 0.2 intervals
x = np.arange(start=20, stop=30, step=0.2)

fig = pygmt.Figure()
fig.basemap(frame=["WSne", "af"], region=[20, 30, -10, 10])

# Create a custom CPT with the batlow CPT and 10 discrete z-values (colors),
# use color_model="+c0-9" to write the color palette in categorical format and
# add labels (0) to (9) for the colorbar legend
pygmt.makecpt(cmap="batlow", series=[0, 9, 1], color_model="+c0-9")

# Plot 10 lines and set a different z-value for each line
for zvalue in range(0, 10):
    y = zvalue * np.sin(x)
    fig.plot(x=x, y=y, cmap=True, zvalue=zvalue, pen="thick,+z,-")

# Color bar to show the custom CPT and the associated z-values
fig.colorbar()
fig.show()
Total running time of the script: ( 0 minutes 2.473 seconds)