Note
Click here to download the full example code
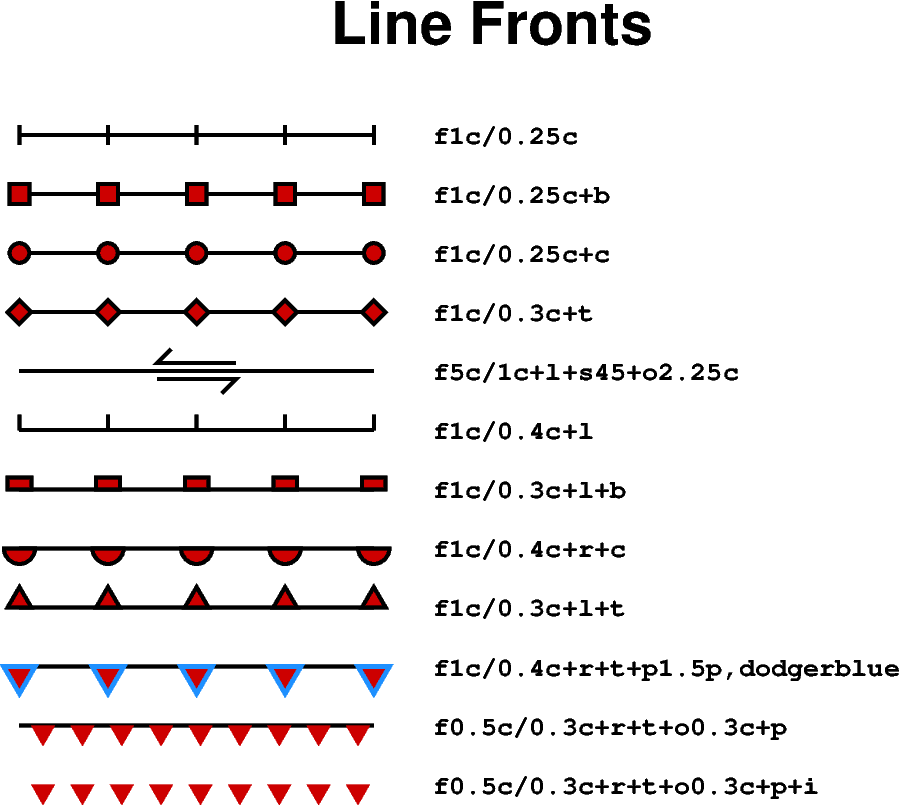
Line fronts
Using the pygmt.Figure.plot method you can draw a so-called
front which allows to plot specific symbols distributed along a line
or curve. Typical use cases are weather fronts, fault lines,
subduction zones, and more.
A front can be drawn by passing f[±]gap[/size] to the style
parameter where gap defines the distance gap between the symbols and
size the symbol size. If gap is negative, it is interpreted to mean
the number of symbols along the front instead. If gap has a leading +
then we use the value exactly as given [Default will start and end each
line with a symbol, hence the gap is adjusted to fit]. If size is
missing it is set to 30% of the gap, except when gap is negative
and size is thus required. Append +l or +r to plot symbols on
the left or right side of the front [Default is centered]. Append
+type to specify which symbol to plot: box, circle,
fault (default), slip, or triangle. Slip means left-lateral
or right-lateral strike-slip arrows (centered is not an option). The +s
modifier optionally accepts the angle used to draw the vector (default is
20). Alternatively, use +S which draws arcuate arrow heads. Append
+ooffset to offset the first symbol from the beginning of the front
by that amount (default is 0). The chosen symbol is drawn with the same pen
as set for the line (i.e., via the pen parameter). To use an alternate
pen, append +ppen. To skip the outline, just use +p with no
argument. To make the main front line invisible, add +i.
Out:
<IPython.core.display.Image object>
import numpy as np
import pygmt

# Generate a two-point line for plotting
x = np.array([1, 4])
y = np.array([20, 20])

fig = pygmt.Figure()
fig.basemap(region=[0, 10, 0, 20], projection="X15c/15c", frame='+t"Line Fronts"')

# Plot the line using different front styles
for frontstyle in [
    # line with "faults" front style, same as +f (default)
    "f1c/0.25c",
    # line with box front style
    "f1c/0.25c+b",
    # line with circle front style
    "f1c/0.25c+c",
    # line with triangle front style
    "f1c/0.3c+t",
    # line with left-lateral ("+l") slip ("+s") front style, angle is set to 45
    # and offset to 2.25 cm
    "f5c/1c+l+s45+o2.25c",
    # line with "faults" front style, symbols are plotted on the left side of
    # the front
    "f1c/0.4c+l",
    # line with box front style, symbols are plotted on the left side of the
    # front
    "f1c/0.3c+l+b",
    # line with circle front style, symbols are plotted on the right side of
    # the front
    "f1c/0.4c+r+c",
    # line with triangle front style, symbols are plotted on the left side of
    # the front
    "f1c/0.3c+l+t",
    # line with triangle front style, symbols are plotted on the right side of
    # the front, use other pen for the outline of the symbol
    "f1c/0.4c+r+t+p1.5p,dodgerblue",
    # line with triangle front style, symbols are plotted on the right side of
    # the front and offset is set to 0.3 cm, skip the outline
    "f0.5c/0.3c+r+t+o0.3c+p",
    # line with triangle front style, symbols are plotted on the right side of
    # the front and offset is set to 0.3 cm, skip the outline and make the main
    # front line invisible
    "f0.5c/0.3c+r+t+o0.3c+p+i",
]:
    y -= 1  # move the current line down
    fig.plot(x=x, y=y, pen="1.25p", style=frontstyle, color="red3")
    fig.text(
        x=x[-1],
        y=y[-1],
        text=frontstyle,
        font="Courier-Bold",
        justify="ML",
        offset="0.75c/0c",
    )

fig.show()
Total running time of the script: ( 0 minutes 3.951 seconds)