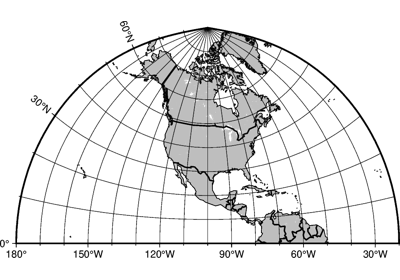
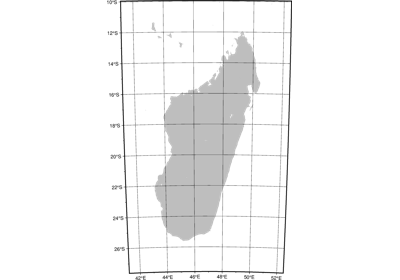
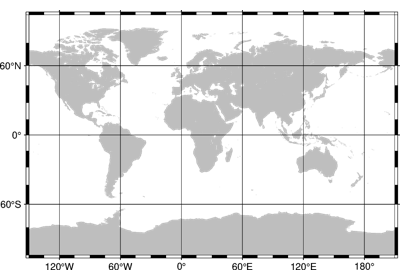
pygmt.Figure.coast
- Figure.coast(*, region=None, projection=None, area_thresh=None, lakes=None, frame=None, resolution=None, dcw=None, rivers=None, map_scale=None, borders=None, shorelines=None, land=None, water=None, timestamp=None, verbose=None, panel=None, perspective=None, transparency=None, **kwargs)
Plot continents, shorelines, rivers, and borders on maps.
Plots grayshaded, colored, or textured land-masses [or water-masses] on maps and [optionally] draws coastlines, rivers, and political boundaries. Alternatively, it can (1) issue clip paths that will contain all land or all water areas, or (2) dump the data to an ASCII table. The data files come in 5 different resolutions: (f)ull, (h)igh, (i)ntermediate, (l)ow, and (c)rude. The full resolution files amount to more than 55 Mb of data and provide great detail; for maps of larger geographical extent it is more economical to use one of the other resolutions. If the user selects to paint the land-areas and does not specify fill of water-areas then the latter will be transparent (i.e., earlier graphics drawn in those areas will not be overwritten). Likewise, if the water-areas are painted and no land fill is set then the land-areas will be transparent.
A map projection must be supplied.
Full option list at https://docs.generic-mapping-tools.org/latest/coast.html
Aliases:
A = area_thresh
B = frame
C = lakes
D = resolution
E = dcw
G = land
I = rivers
J = projection
L = map_scale
N = borders
R = region
S = water
U = timestamp
V = verbose
W = shorelines
c = panel
p = perspective
t = transparency
- Parameters
projection (str) – projcode[projparams/]width. Select map projection.
region (str or list) – xmin/xmax/ymin/ymax[+r][+uunit]. Specify the region of interest. Required if this is the first plot command.
area_thresh (int or float or str) – min_area[/min_level/max_level][+a[g|i][s|S]][+l|r][+ppercent]. Features with an area smaller than min_area in km2 or of hierarchical level that is lower than min_level or higher than max_level will not be plotted [Default is 0/0/4 (all features)].
frame (bool or str or list) – Set map boundary frame and axes attributes.
lakes (str or list) – fill[+l|+r]. Set the shade, color, or pattern for lakes and river-lakes. The default is the fill chosen for wet areas set by the
waterparameter. Optionally, specify separate fills by appending +l for lakes or +r for river-lakes, and passing multiple strings in a list.resolution (str) – f|h|i|l|c. Selects the resolution of the data set to: (f)ull, (h)igh, (i)ntermediate, (l)ow, and (c)rude.
land (str) – Select filling or clipping of “dry” areas.
river[/pen]. Draw rivers. Specify the type of rivers and [optionally] append pen attributes [Default is
"0.25p,black,solid"].Choose from the list of river types below; pass a list to
riversto use multiple arguments.0 = Double-lined rivers (river-lakes)
1 = Permanent major rivers
2 = Additional major rivers
3 = Additional rivers
4 = Minor rivers
5 = Intermittent rivers - major
6 = Intermittent rivers - additional
7 = Intermittent rivers - minor
8 = Major canals
9 = Minor canals
10 = Irrigation canals
You can also choose from several preconfigured river groups:
a = All rivers and canals (0-10)
A = All rivers and canals except river-lakes (1-10)
r = All permanent rivers (0-4)
R = All permanent rivers except river-lakes (1-4)
i = All intermittent rivers (5-7)
c = All canals (8-10)
map_scale (str) – [g|j|J|n|x]refpoint+wlength. Draws a simple map scale centered on the reference point specified.
borders (int or str or list) –
border[/pen]. Draw political boundaries. Specify the type of boundary and [optionally] append pen attributes [Default is
"0.25p,black,solid"].Choose from the list of boundaries below. Pass a list to
bordersto use multiple arguments.1 = National boundaries
2 = State boundaries within the Americas
3 = Marine boundaries
a = All boundaries (1-3)
water (str) – Select filling or clipping of “wet” areas.
shorelines (int or str or list) – [level/]pen. Draw shorelines [Default is no shorelines]. Append pen attributes [Default is
"0.25p,black,solid"] which apply to all four levels. To set the pen for a single level, pass a string with level/pen, where level is 1-4 and represent coastline, lakeshore, island-in-lake shore, and lake-in-island-in-lake shore. Pass a list of level/pen strings toshorelinesto set multiple levels. When specific level pens are set, those not listed will not be drawn.dcw (str or list) – code1,code2,…[+l|L][+gfill] [+ppen][+z]. Select painting or dumping country polygons from the Digital Chart of the World. Append one or more comma-separated countries using the 2-character ISO 3166-1 alpha-2 convention. To select a state of a country (if available), append .state, (e.g, US.TX for Texas). To specify a whole continent, prepend = to any of the continent codes (e.g. =EU for Europe). Append +ppen to draw polygon outlines [Default is no outline] and +gfill to fill them [Default is no fill]. Append +l|+L to =continent to only list countries in that continent; repeat if more than one continent is requested.
panel (bool or int or list) – [row,col|index]. Select a specific subplot panel. Only allowed when in subplot mode. Use
panel=Trueto advance to the next panel in the selected order. Instead of row,col you may also give a scalar value index which depends on the order you set viaautolabelwhen the subplot was defined. Note: row, col, and index all start at 0.perspective (list or str) – [x|y|z]azim[/elev[/zlevel]][+wlon0/lat0[/z0]][+vx0/y0]. Select perspective view and set the azimuth and elevation angle of the viewpoint. Default is [180, 90]. Full documentation is at https://docs.generic-mapping-tools.org/latest/gmt.html#perspective-full.
transparency (int or float) – Set transparency level, in [0-100] percent range [Default is 0, i.e., opaque]. Only visible when PDF or raster format output is selected. Only the PNG format selection adds a transparency layer in the image (for further processing).
Select verbosity level [Default is w], which modulates the messages written to stderr. Choose among 7 levels of verbosity:
q - Quiet, not even fatal error messages are produced
e - Error messages only
w - Warnings [Default]
t - Timings (report runtimes for time-intensive algorithms)
i - Informational messages (same as
verbose=True)c - Compatibility warnings
d - Debugging messages
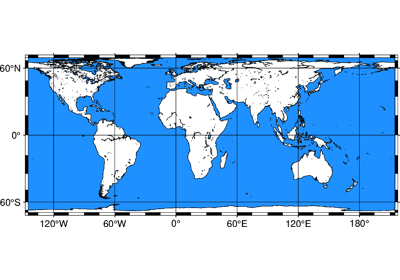
Example
>>> import pygmt
>>> # Create a new plot with pygmt.Figure()
>>> fig = pygmt.Figure()
>>> # Call the coast method for the plot
>>> fig.coast(
...     # Set the projection to Mercator, and plot size to 10 cm
...     projection="M10c",
...     # Set the region of the plot
...     region=[-10, 30, 30, 60],
...     # Set the frame of the plot
...     frame="a",
...     # Set the color of the land to "darkgreen"
...     land="darkgreen",
...     # Set the color of the water to "lightblue"
...     water="lightblue",
...     # Draw national borders with a 1-point black line
...     borders="1/1p,black",
... )
>>> # Show the plot
>>> fig.show()