Note
Click here to download the full example code
Frames, ticks, titles, and labels
Setting frame, ticks, title, etc., of the plot is handled by the frame
parameter that most plotting methods of the pygmt.Figure class
contain.
import pygmt
Plot frame
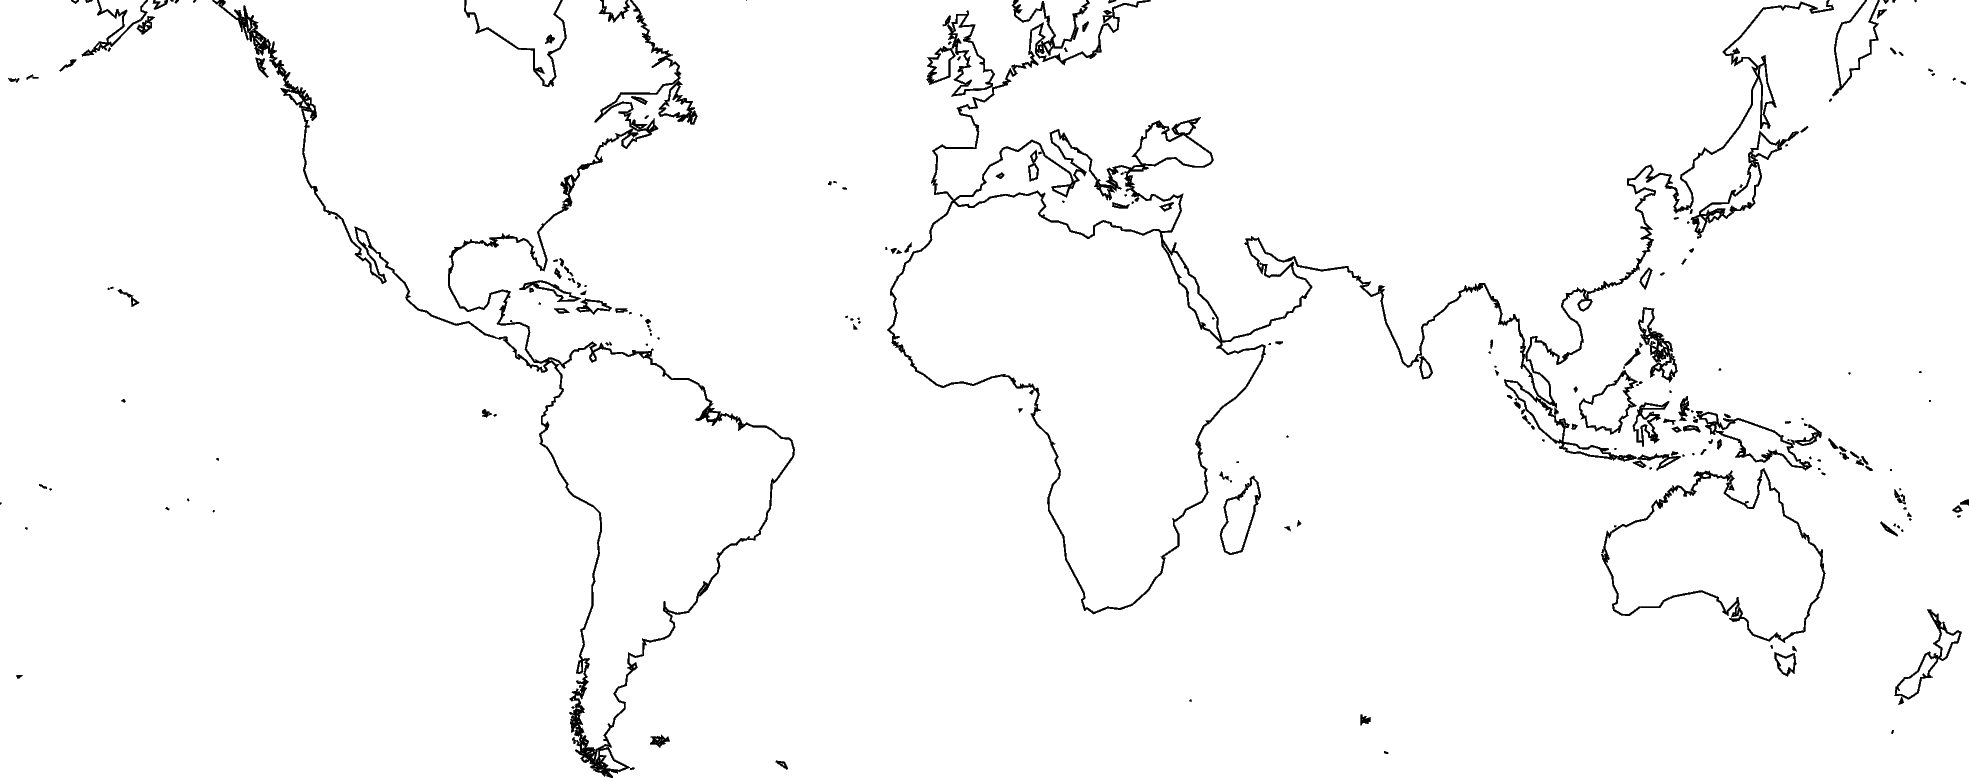
By default, PyGMT does not add a frame to your plot. For example, we can plot the coastlines of the world with a Mercator projection:
fig = pygmt.Figure()
fig.coast(shorelines="1/0.5p", region=[-180, 180, -60, 60], projection="M25c")
fig.show()
<IPython.core.display.Image object>
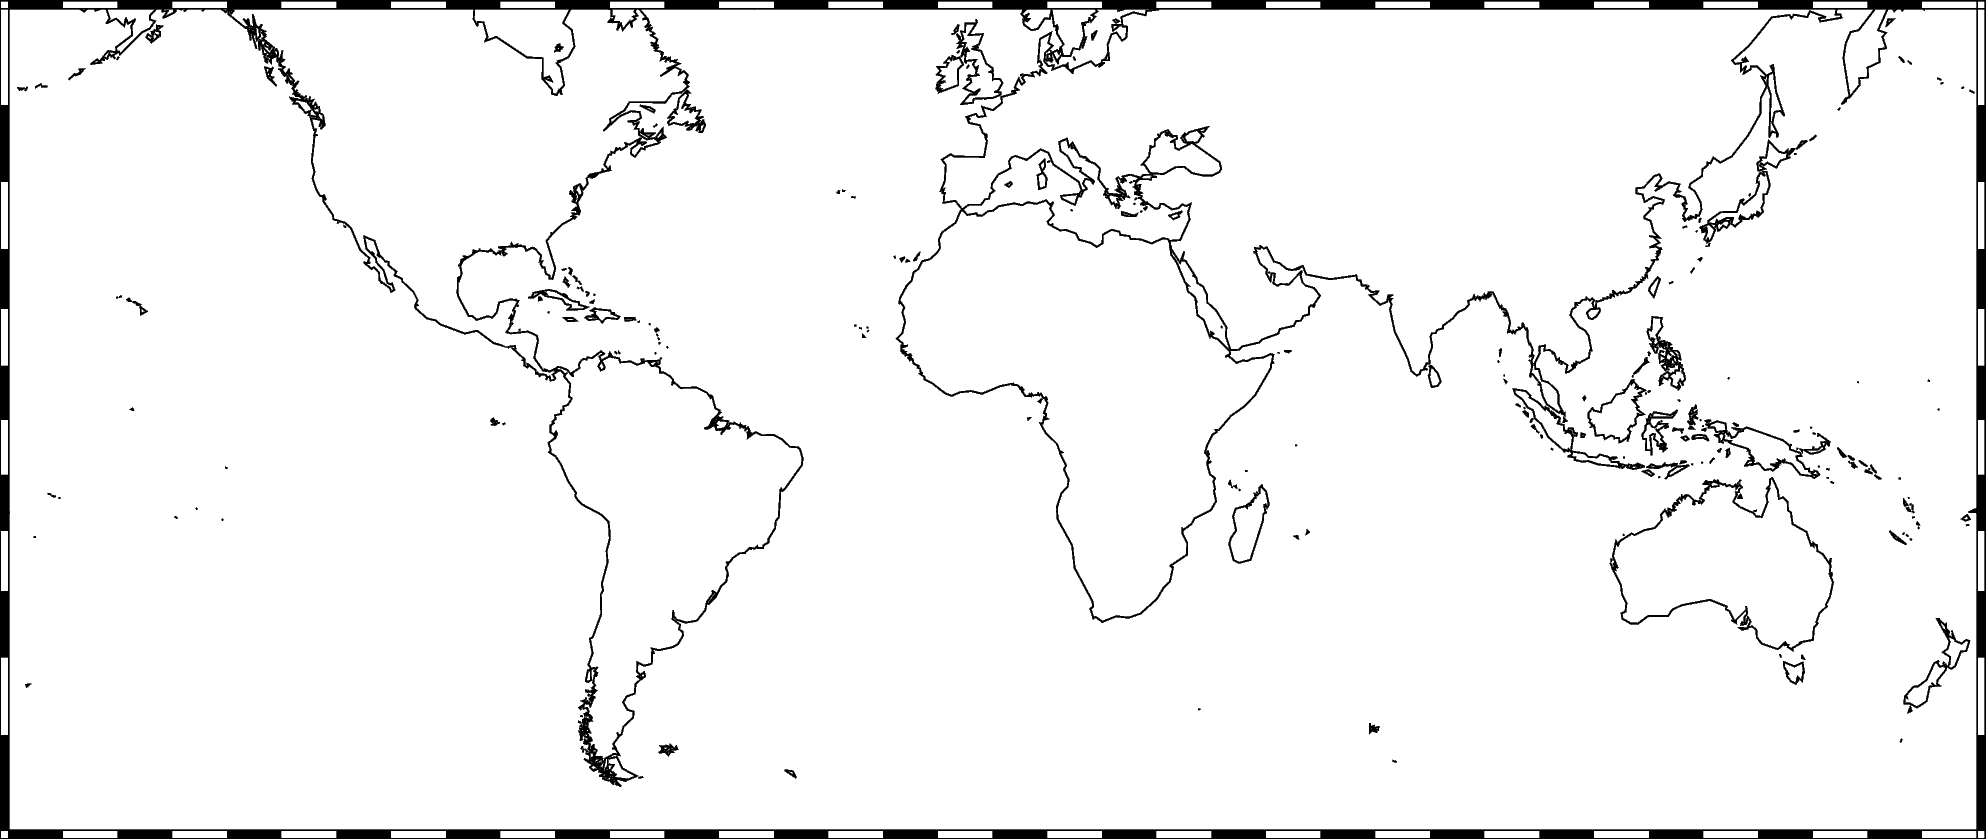
To add the default GMT frame style to the plot, use frame="f" in
pygmt.Figure.basemap or another plotting method (which has the
frame parameter, with exception of pygmt.Figure.colorbar):
fig = pygmt.Figure()
fig.coast(shorelines="1/0.5p", region=[-180, 180, -60, 60], projection="M25c")
fig.basemap(frame="f")
fig.show()
<IPython.core.display.Image object>
Ticks and grid lines
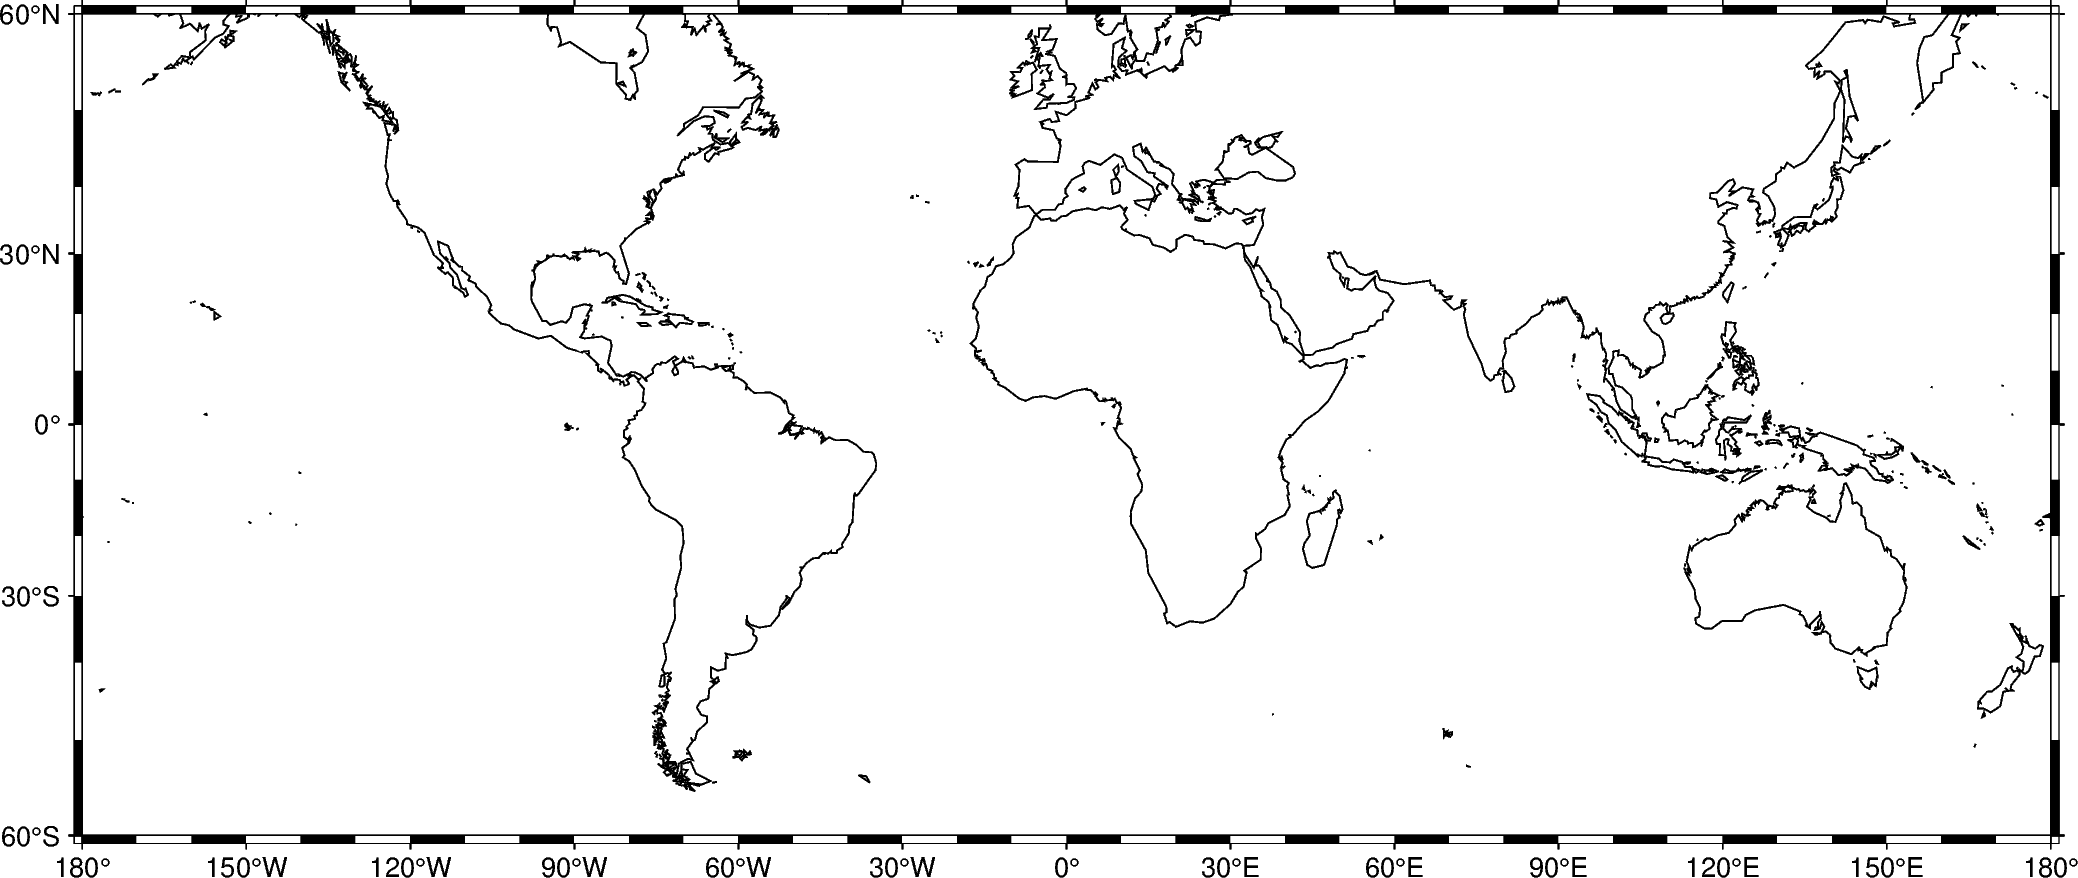
The automatic frame (frame=True or frame="af") adds the default GMT
frame style and automatically determines tick labels from the plot region.
In GMT the tick labels are called annotations.
fig = pygmt.Figure()
fig.coast(shorelines="1/0.5p", region=[-180, 180, -60, 60], projection="M25c")
fig.basemap(frame="af")
fig.show()
<IPython.core.display.Image object>
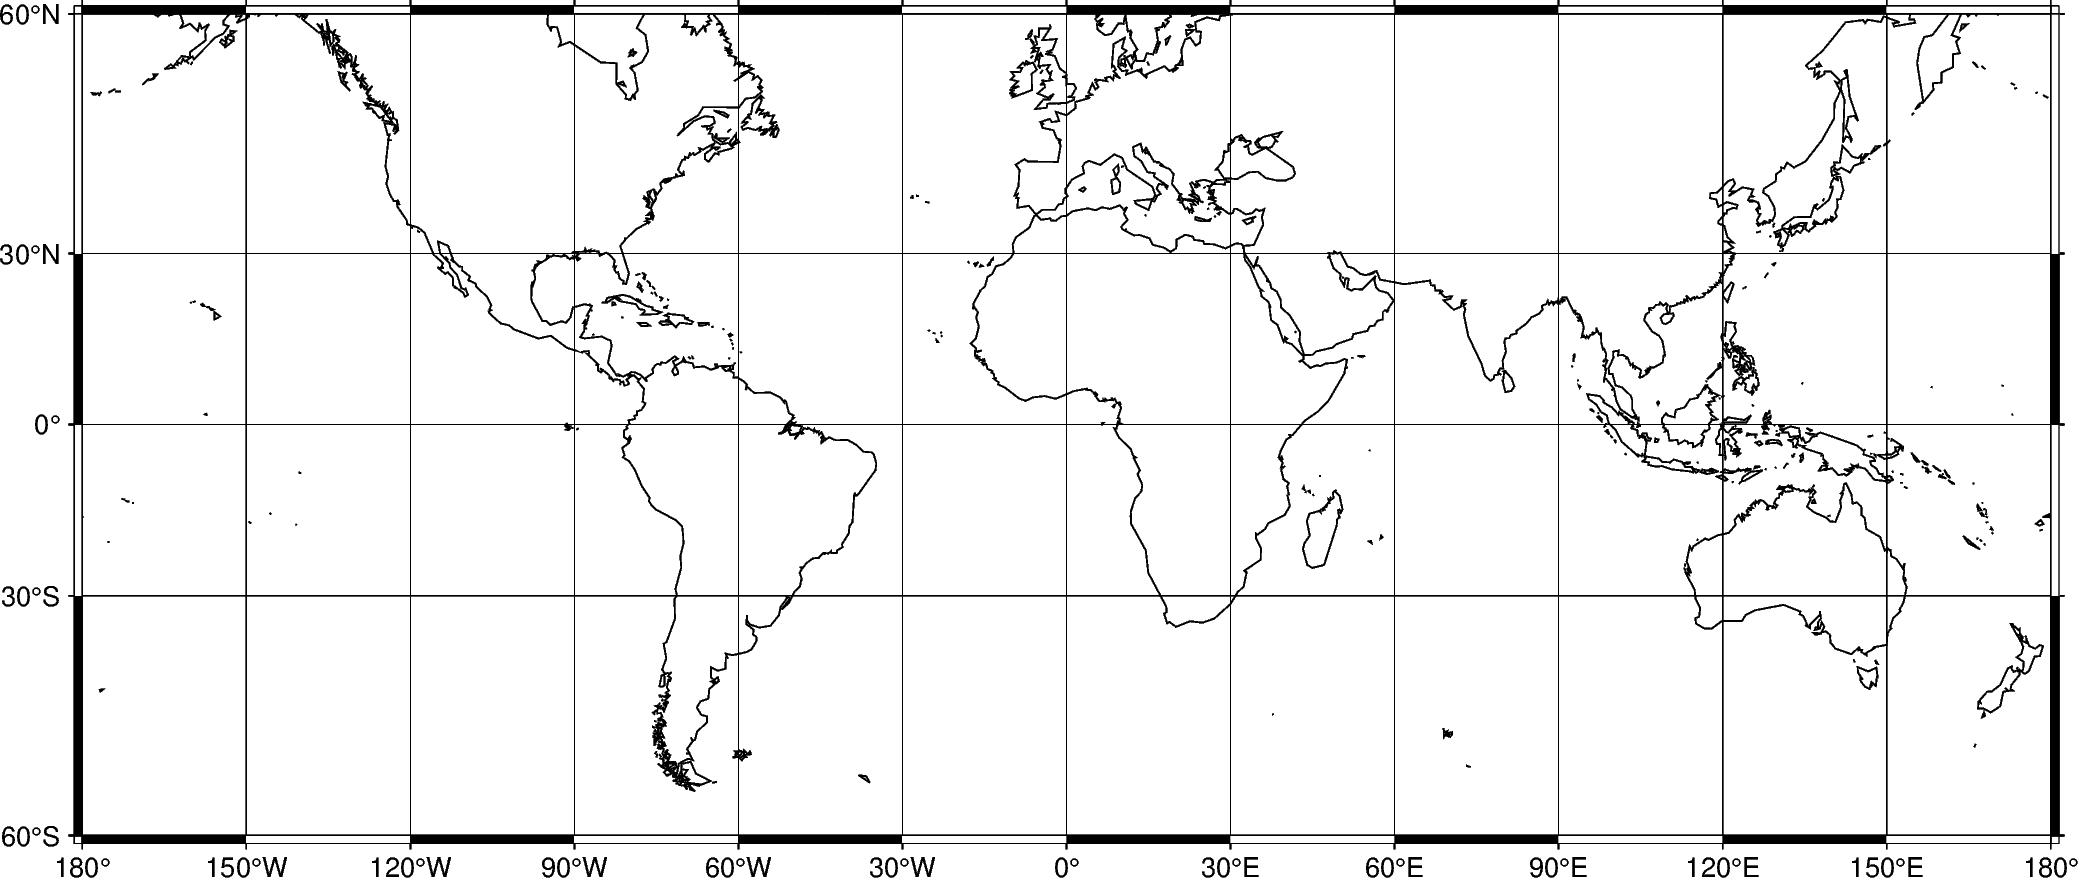
Add automatic grid lines to the plot by passing g through the frame
parameter:
fig = pygmt.Figure()
fig.coast(shorelines="1/0.5p", region=[-180, 180, -60, 60], projection="M25c")
fig.basemap(frame="ag")
fig.show()
<IPython.core.display.Image object>
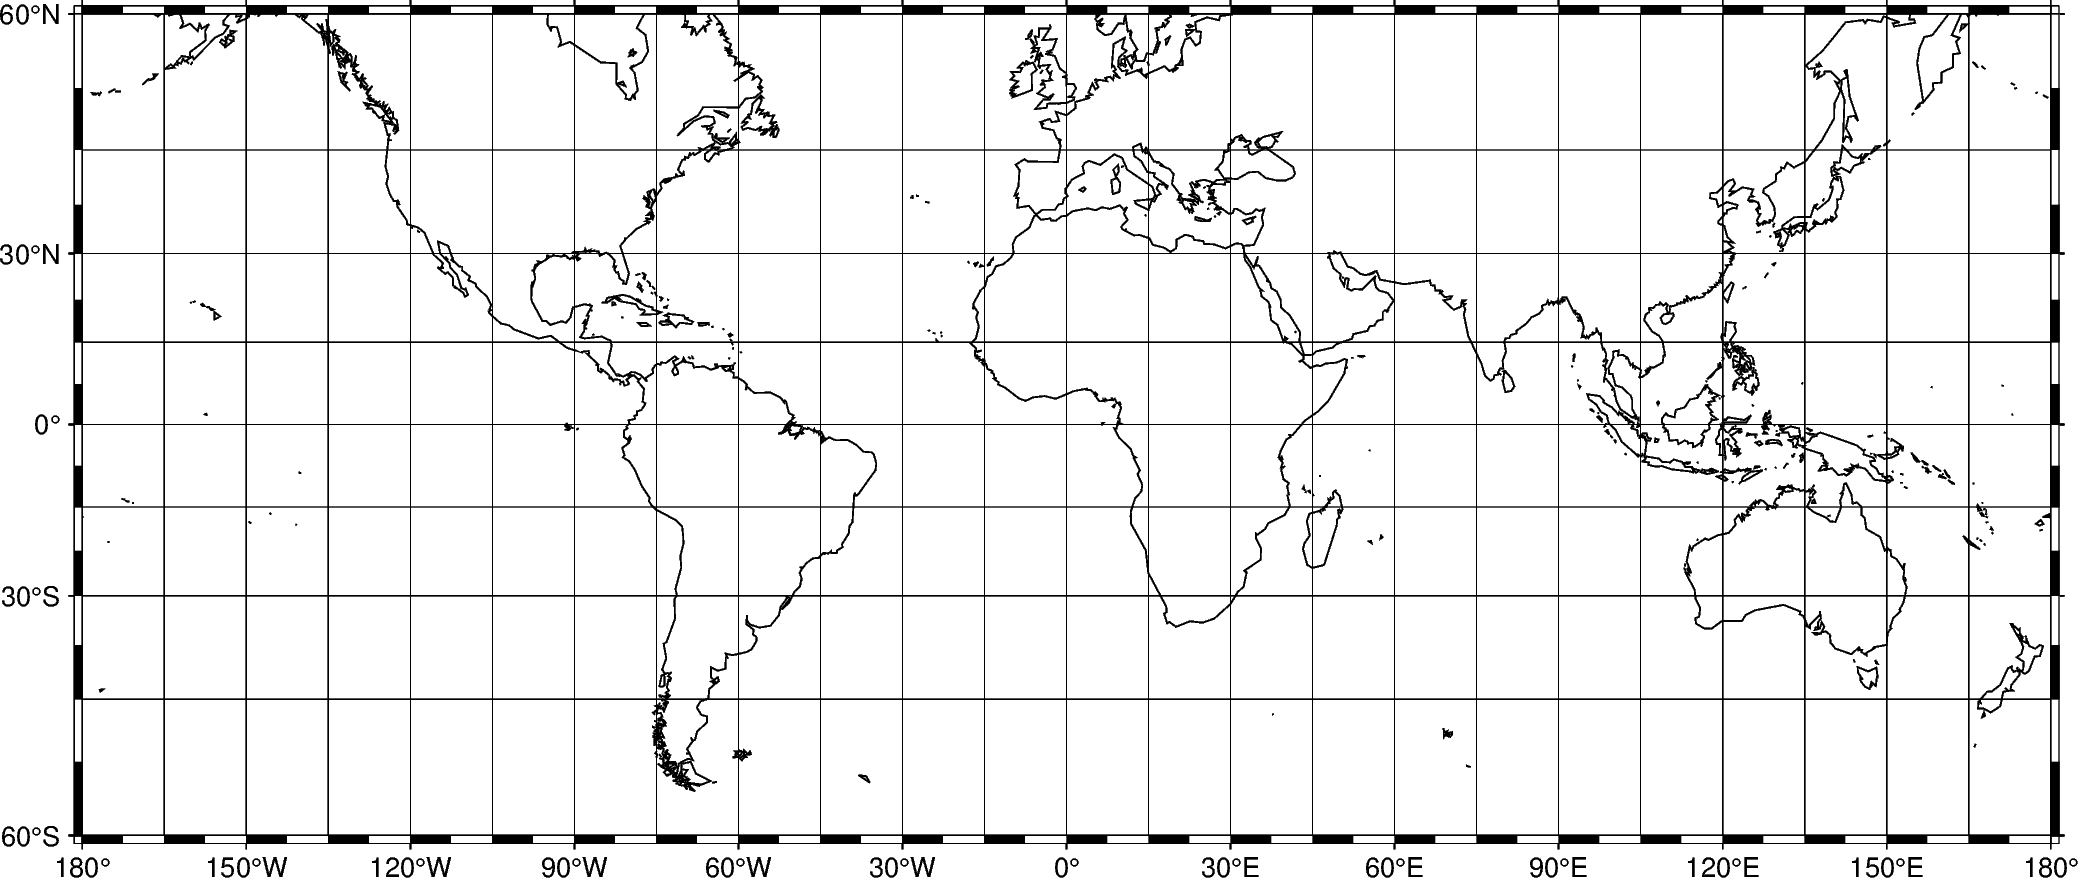
To adjust the step widths of annotations, frame, and grid lines we can
add the desired step widths after a, f, or g. In the example
below, the step widths are set to 30°, 7.5°, and 15°, respectively.
fig = pygmt.Figure()
fig.coast(shorelines="1/0.5p", region=[-180, 180, -60, 60], projection="M25c")
fig.basemap(frame="a30f7.5g15")
fig.show()
<IPython.core.display.Image object>
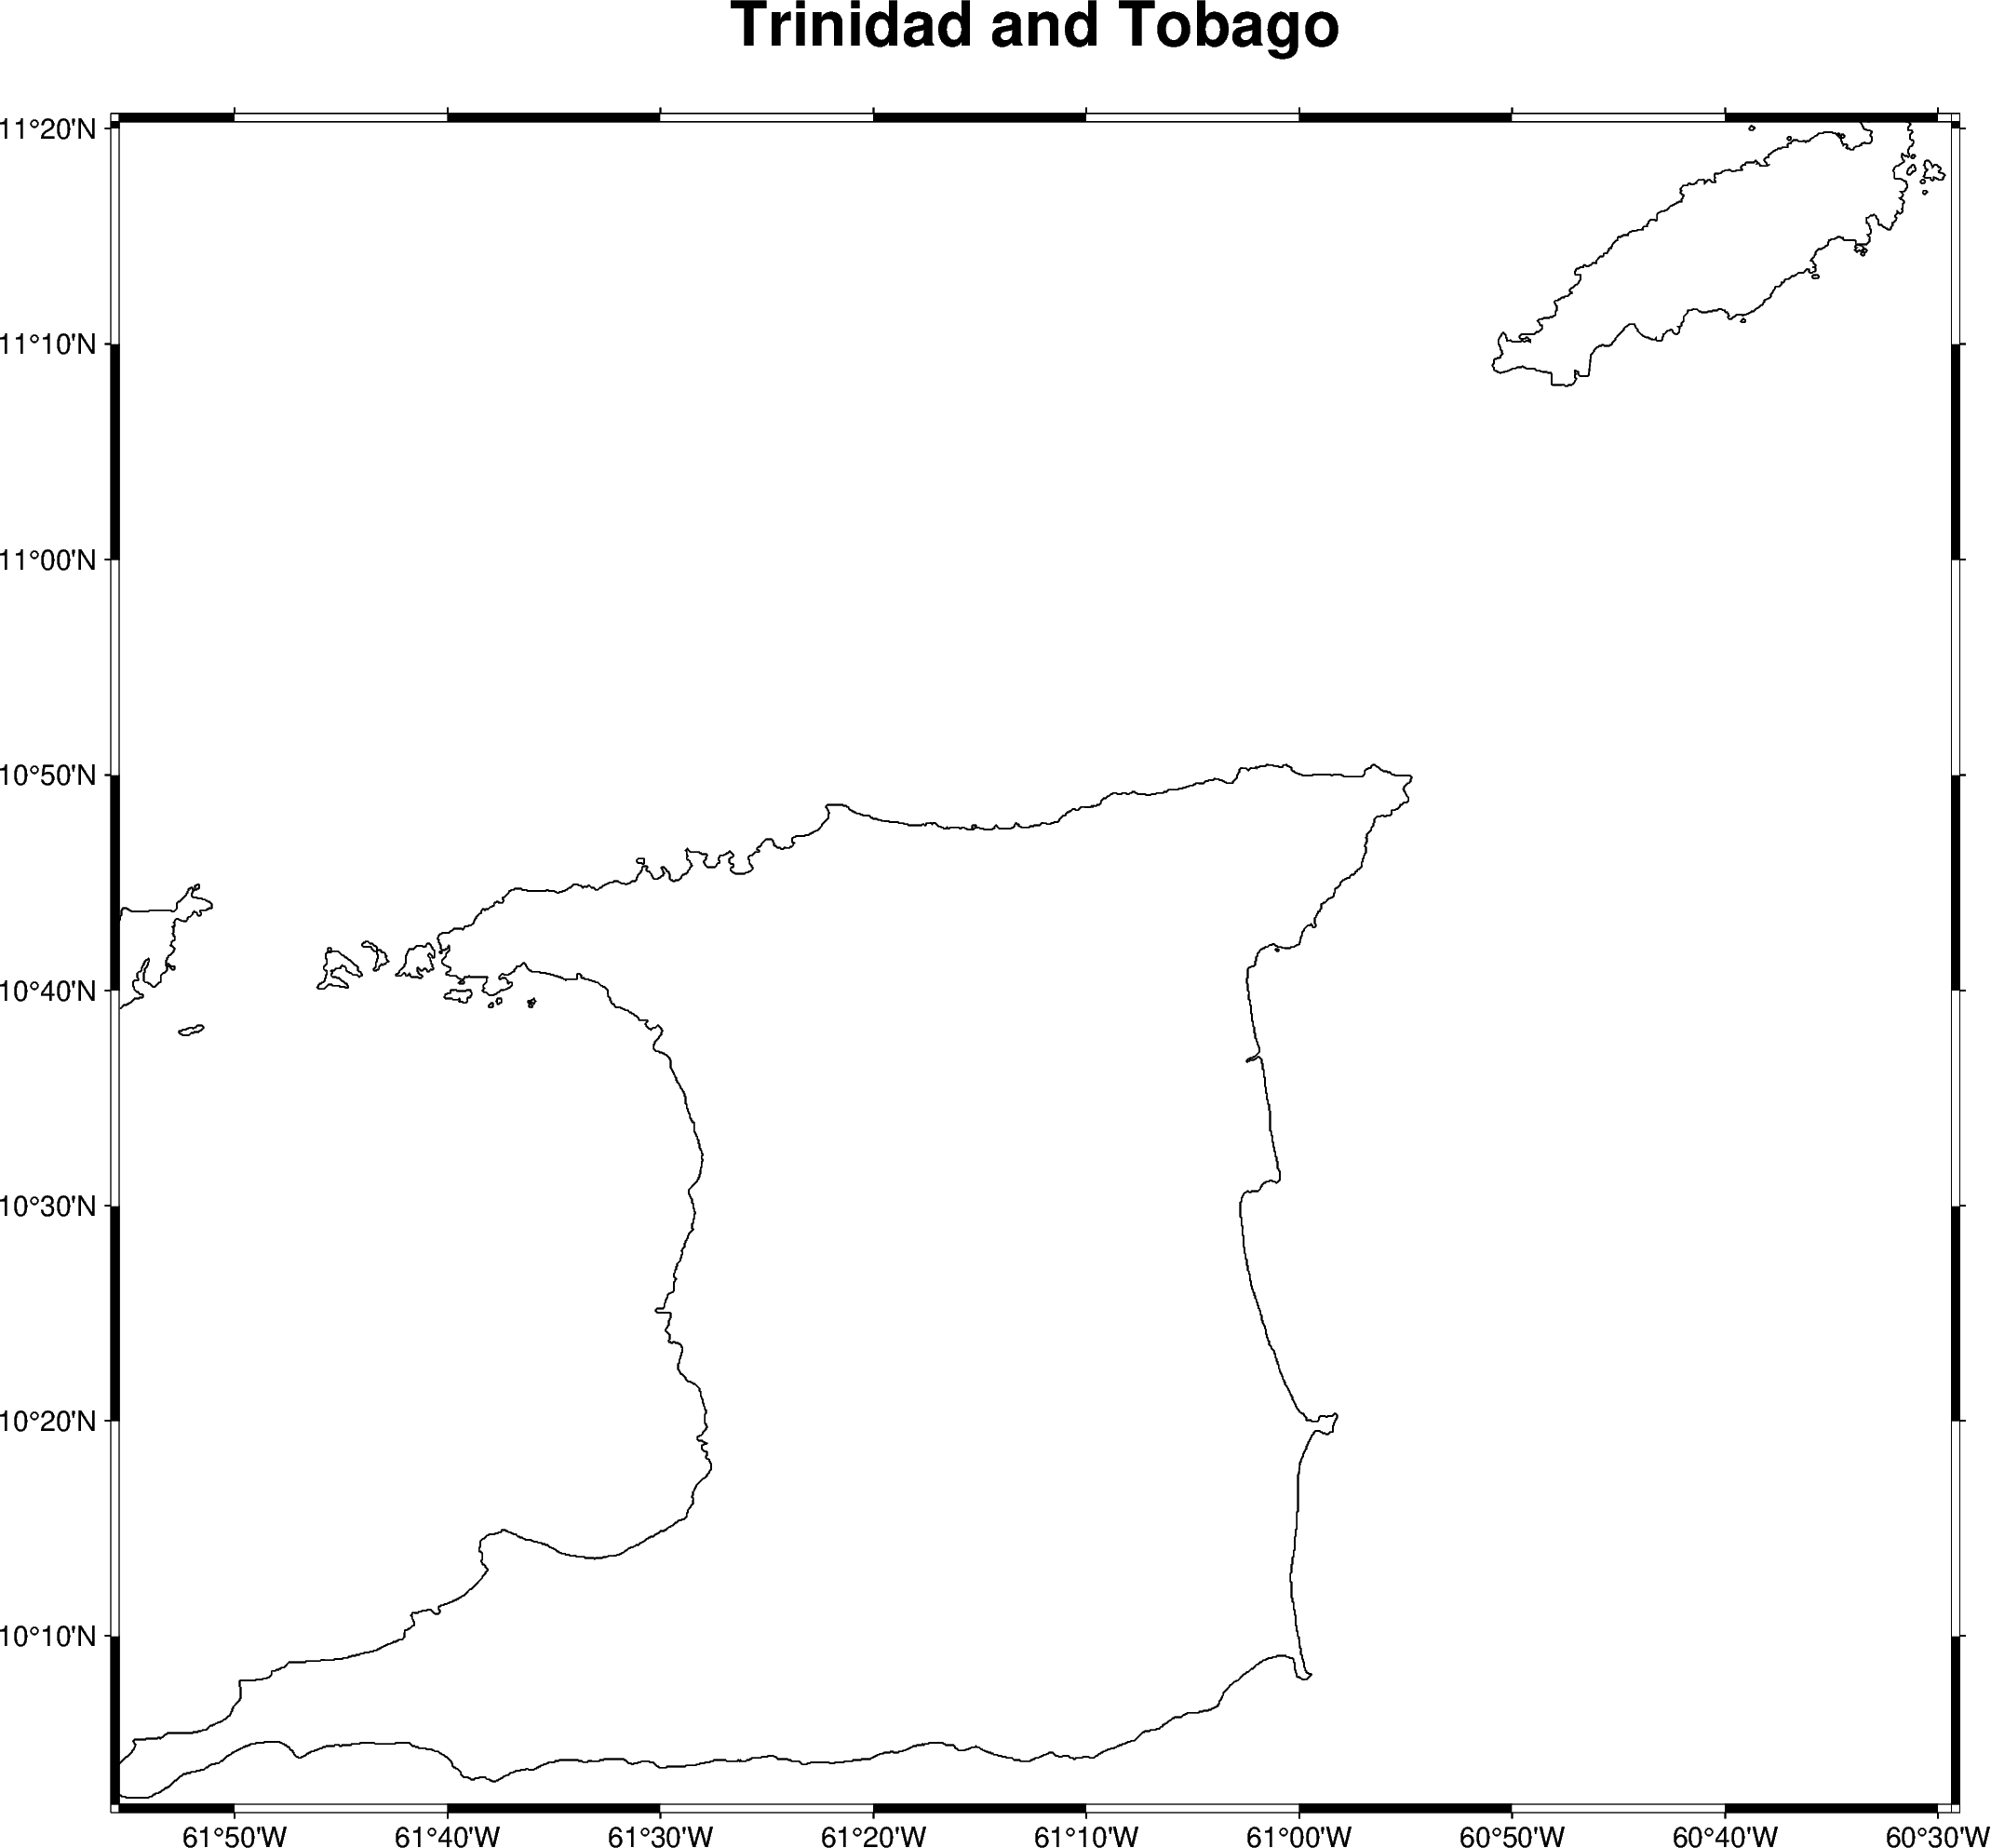
Title
The figure title can be set by passing +ttitle to the frame
parameter of pygmt.Figure.basemap. Passing multiple arguments to
frame can be done by using a list, as show in the example below.
fig = pygmt.Figure()
# region="TT" specifies Trinidad and Tobago using the ISO country code
fig.coast(shorelines="1/0.5p", region="TT", projection="M25c")
fig.basemap(frame=["a", "+tTrinidad and Tobago"])
fig.show()
<IPython.core.display.Image object>
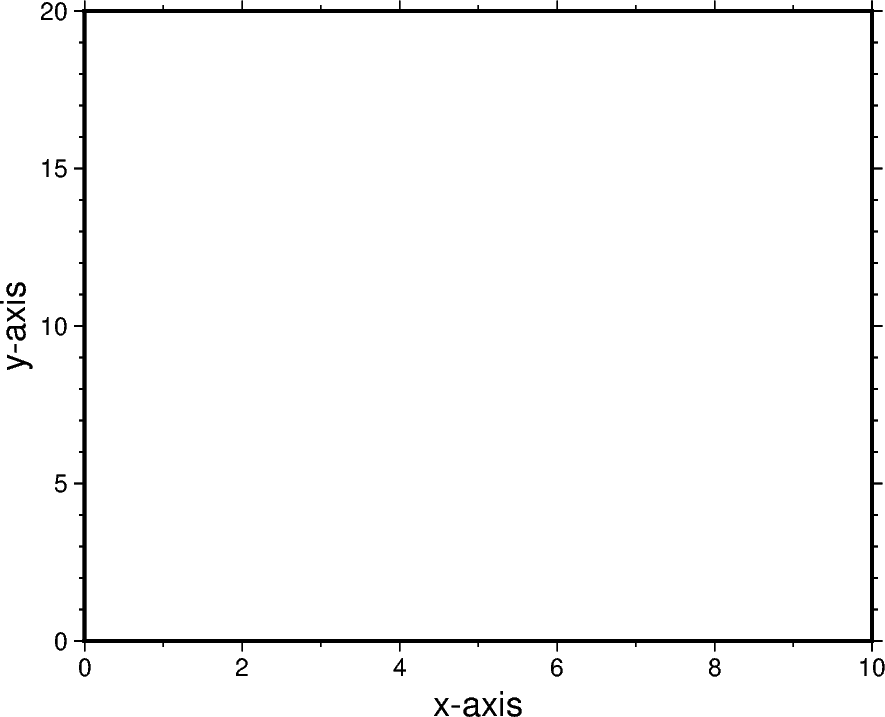
Axis labels
Axis labels, in GMT simply called labels, can be set by passing
x+llabel (or starting with y if
labeling the y-axis) to the frame parameter of
pygmt.Figure.basemap. The map boundaries (or plot axes) are named as
West/west/left (W, w, l), South/south/bottom
(S, s, b), North/north/top (N, n, t), and
East/east/right (E, e, r) sides of a figure. If an upper-case
letter (W, S, N, E) is passed, the axis is plotted with
tick marks and annotations. The lower-case version
(w, s, n, e) plots the axis only with tick marks.
To only plot the axis pass l, b, t, r. By default
(frame=True or frame="af"), the West and the South axes are
plotted with both tick marks and annotations.
The example below uses a Cartesian projection, as GMT does not allow labels to be set for geographic maps.
fig = pygmt.Figure()
fig.basemap(
    region=[0, 10, 0, 20],
    projection="X10c/8c",
    # Plot axis with tick marks, annotations, and labels on the
    # West and South axes
    # Plot axis with tick marks on the north and east axes
    frame=["WSne", "xaf+lx-axis", "yaf+ly-axis"],
)
fig.show()
<IPython.core.display.Image object>
Total running time of the script: ( 0 minutes 9.260 seconds)