Note
Go to the end to download the full example code
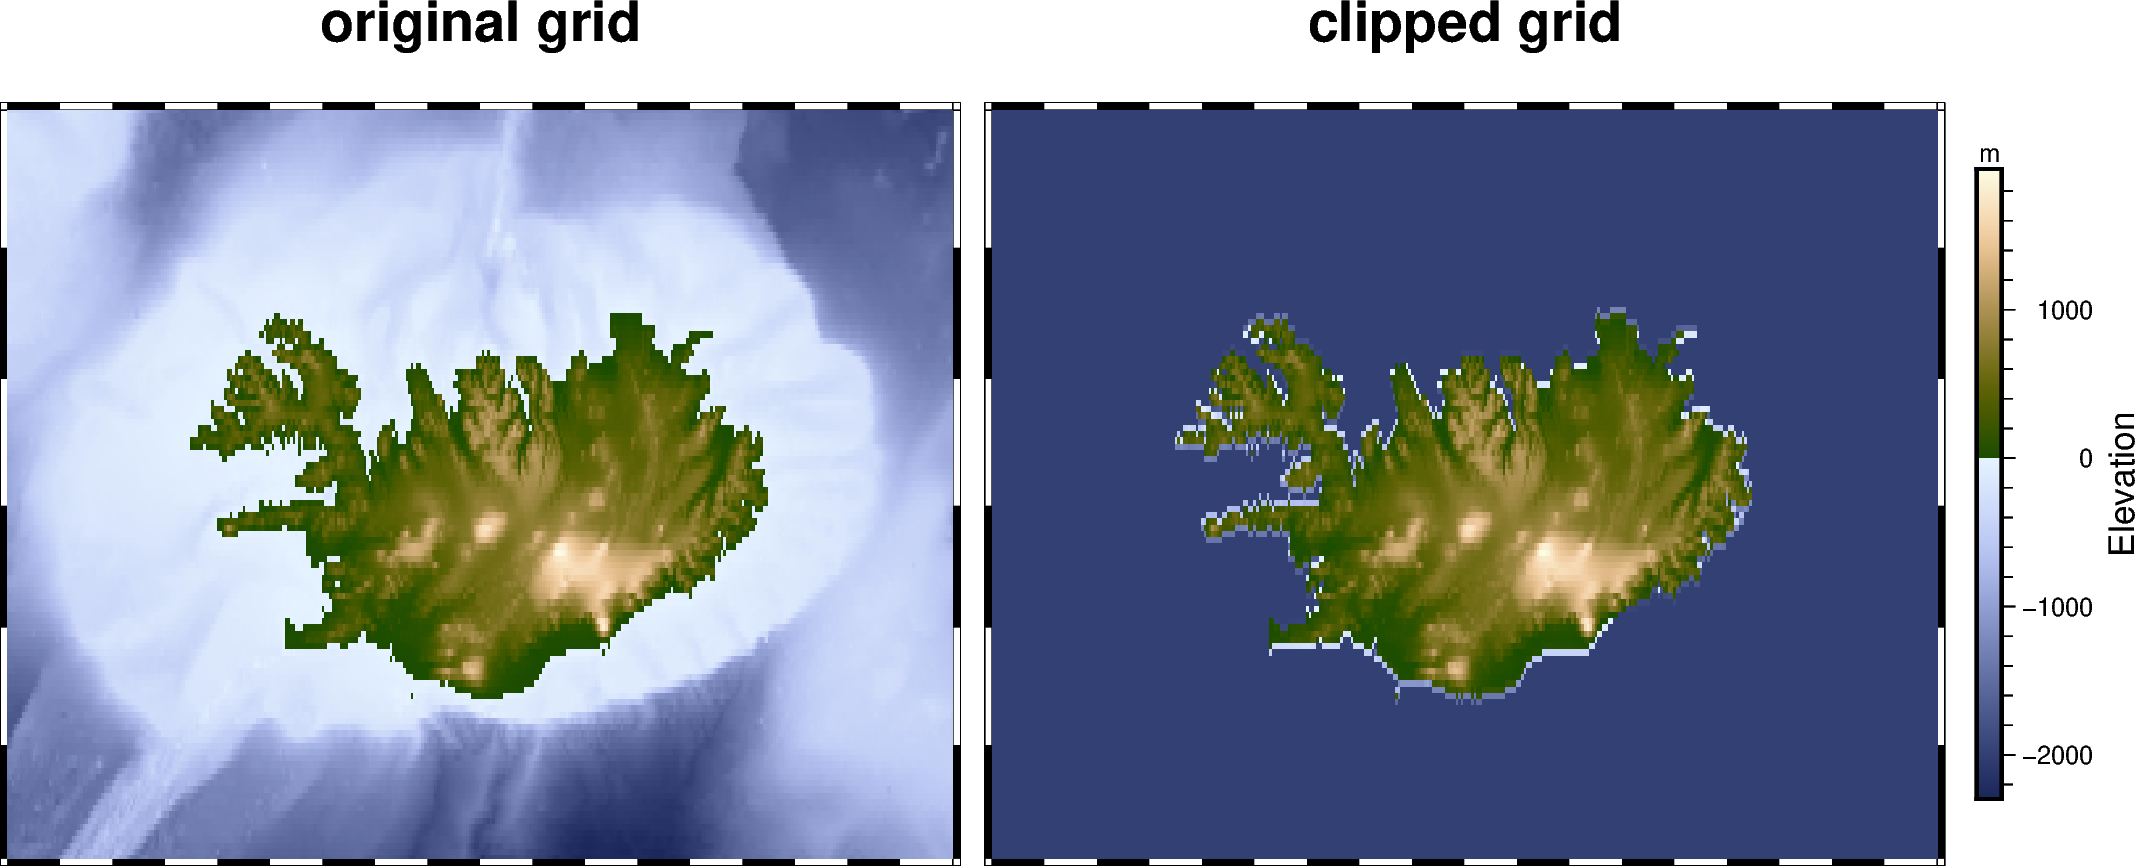
Clipping grid values
The pygmt.grdclip function allows to clip defined ranges of grid
values. In the example shown below we set all elevation values (grid points)
smaller than 0 m (in general the bathymetric part of the grid) to a common
value of -2000 m via the below parameter.
grdblend [NOTICE]: Remote data courtesy of GMT data server oceania [http://oceania.generic-mapping-tools.org]
grdblend [NOTICE]: SRTM15 Earth Relief at 03x03 arc minutes reduced by Gaussian Cartesian filtering (5.6 km fullwidth) [Tozer et al., 2019].
grdblend [NOTICE]:   -> Download 90x90 degree grid tile (earth_relief_03m_g): N00W090
import pygmt

fig = pygmt.Figure()

# Define region of interest around Iceland
region = [-28, -10, 62, 68]

# Load sample grid (3 arc-minutes global relief) in target area
grid = pygmt.datasets.load_earth_relief(resolution="03m", region=region)

# Plot original grid
fig.basemap(region=region, projection="M12c", frame=["f", "+toriginal grid"])
fig.grdimage(grid=grid, cmap="oleron")

# Shift plot origin of the second map by "width of the first map + 0.5 cm"
# in x direction
fig.shift_origin(xshift="w+0.5c")

# Set all grid points < 0 m to a value of -2000 m.
grid = pygmt.grdclip(grid, below=[0, -2000])

# Plot clipped grid
fig.basemap(region=region, projection="M12c", frame=["f", "+tclipped grid"])
fig.grdimage(grid=grid)
fig.colorbar(frame=["x+lElevation", "y+lm"], position="JMR+o0.5c/0c+w8c")

fig.show()
Total running time of the script: ( 0 minutes 5.088 seconds)