Note
Go to the end to download the full example code
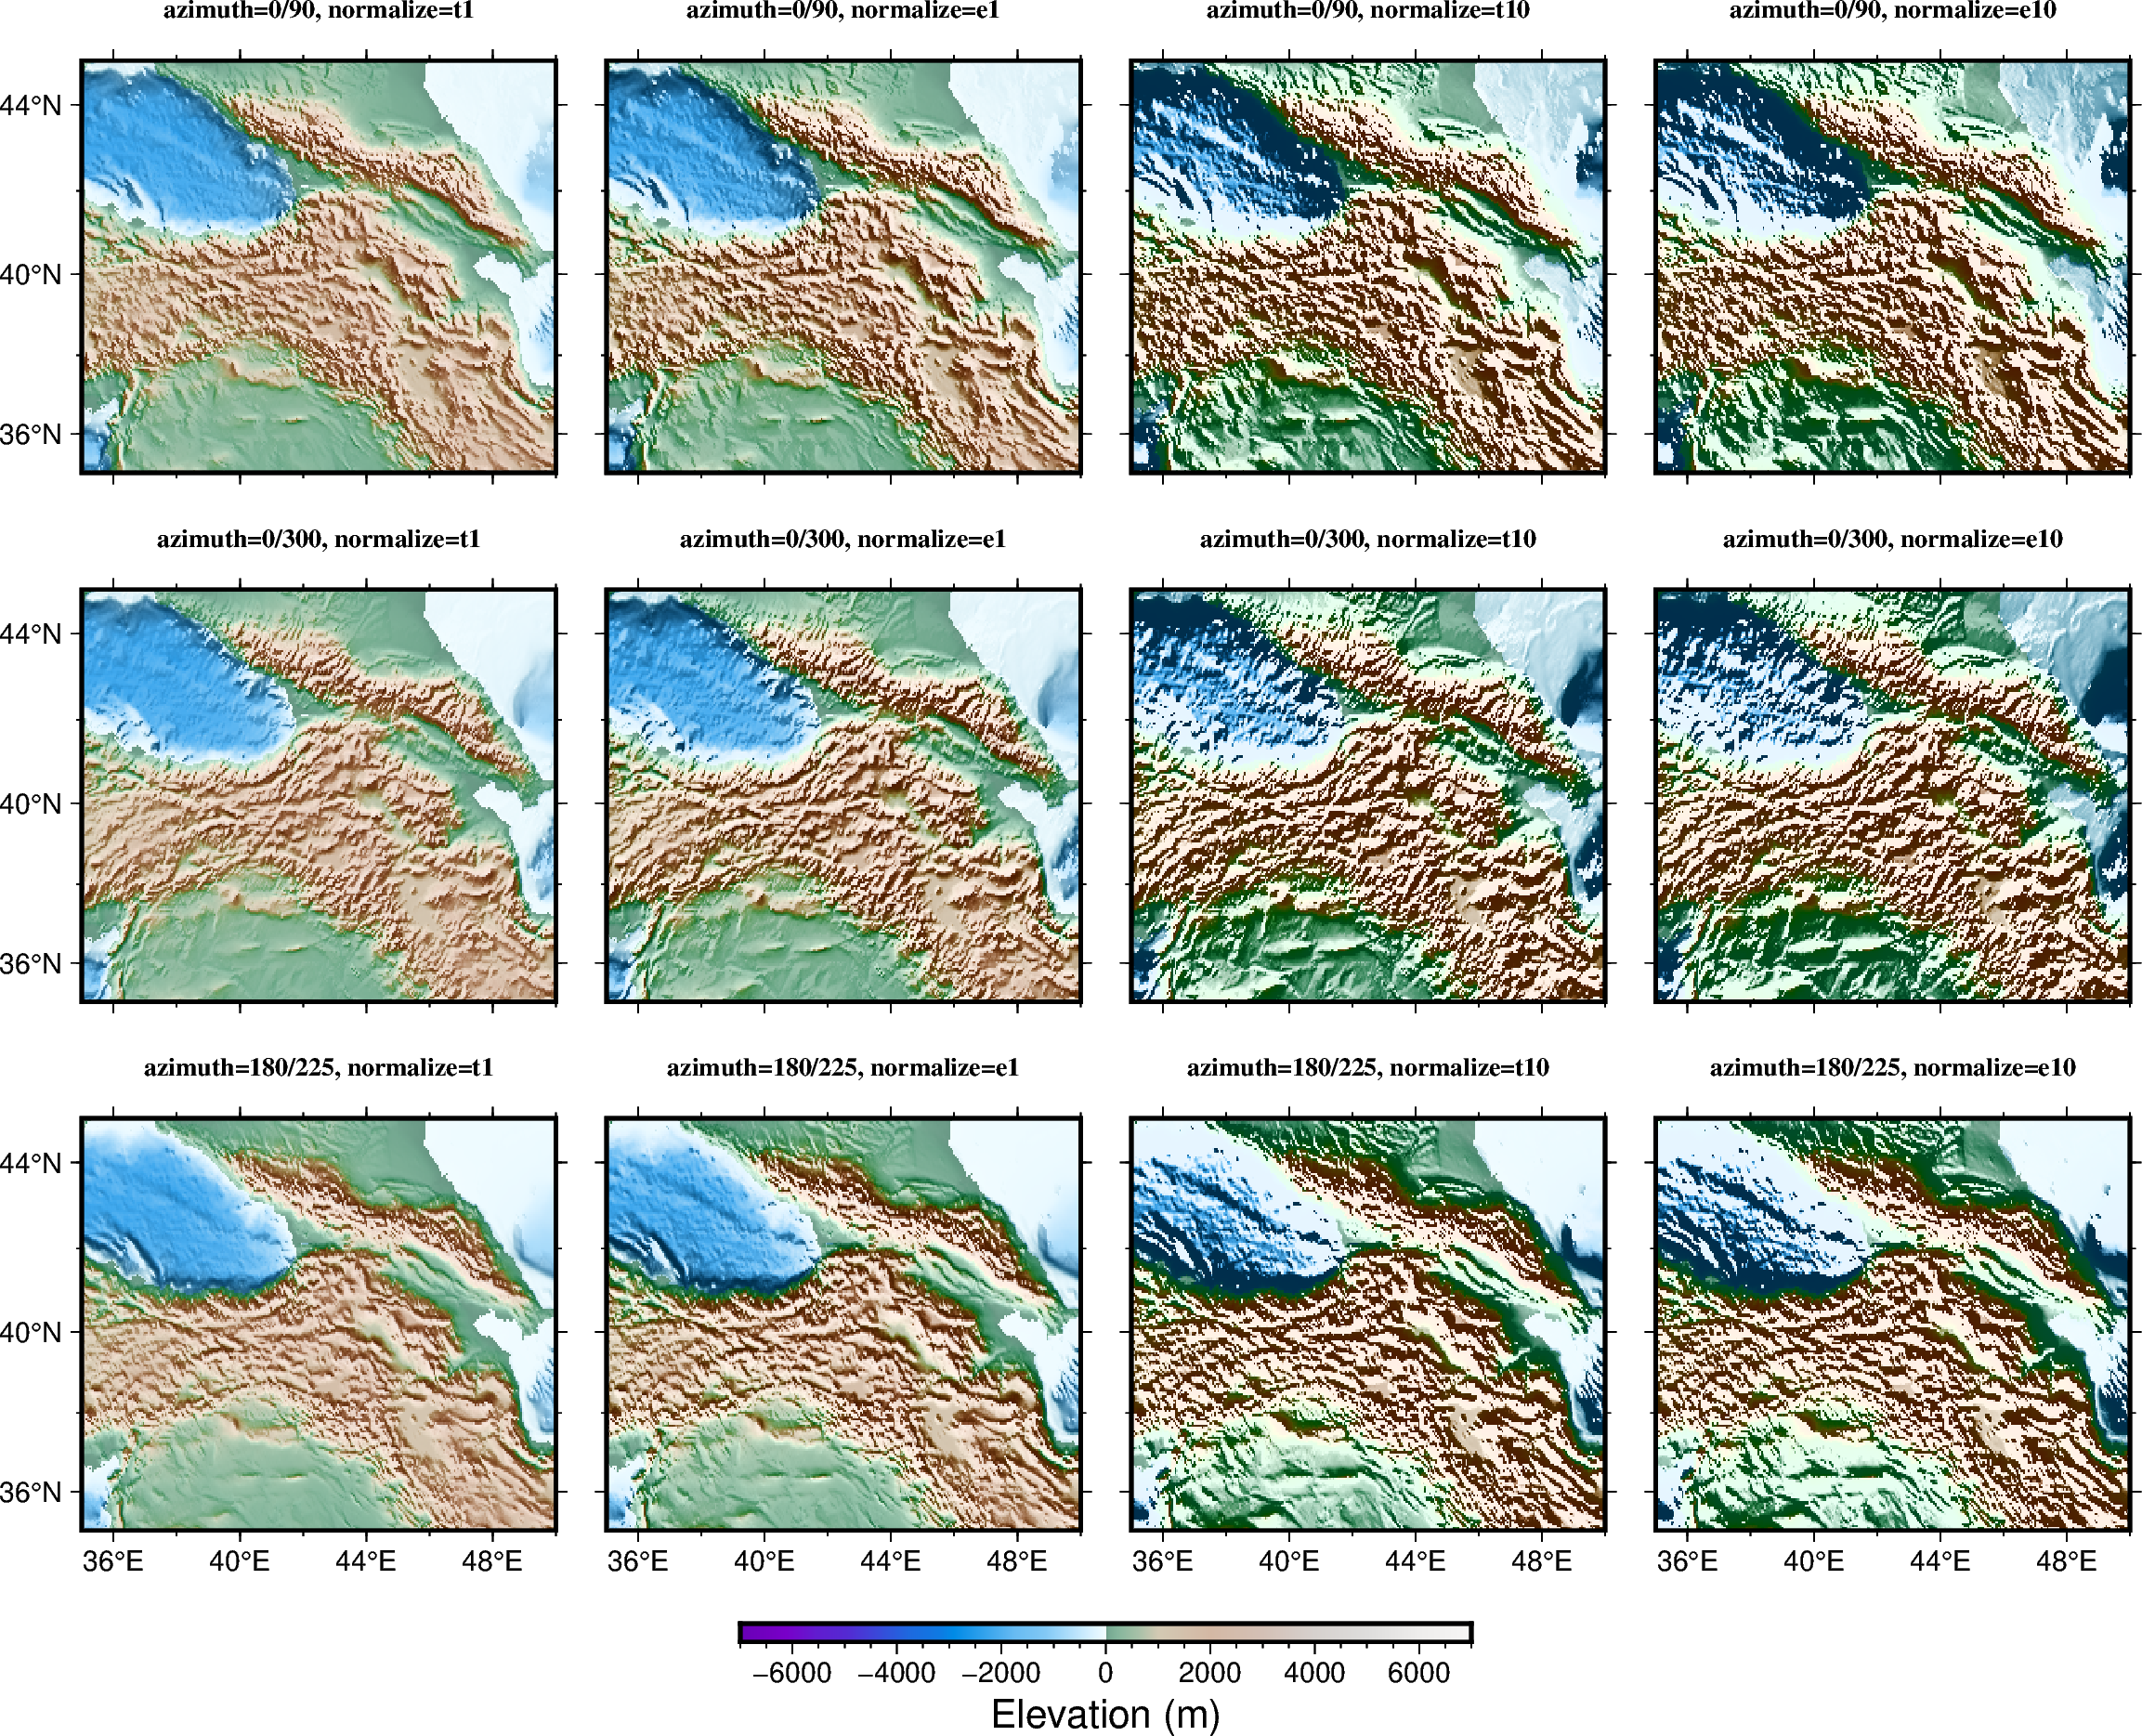
Calculating grid gradient with custom azimuth and normalize parameters
The pygmt.grdgradient function calculates the gradient of a grid file.
As input, pygmt.grdgradient gets a xarray.DataArray object or
a path string to a grid file. It then calculates the respective gradient and
returns an xarray.DataArray object. The example below sets two main
parameters:
azimuth: to set the illumination light source direction (0° is North, 90° is East, 180° is South, 270° is West).normalizeto enhance the three-dimensional sense of the topography.
The normalize parameter calculates the azimuthal gradient of each point
along a certain azimuth angle, then adjusts the brightness value of the color
according to the positive/negative of the azimuthal gradient and the amplitude
of each point.
grdblend [NOTICE]: Remote data courtesy of GMT data server oceania [http://oceania.generic-mapping-tools.org]
grdblend [NOTICE]: SRTM15 Earth Relief at 03x03 arc minutes reduced by Gaussian Cartesian filtering (5.6 km fullwidth) [Tozer et al., 2019].
grdblend [NOTICE]:   -> Download 90x90 degree grid tile (earth_relief_03m_g): N00E000
import pygmt

# Load the 3 arc-minutes global relief grid in the target area around Caucasus
grid = pygmt.datasets.load_earth_relief(resolution="03m", region=[35, 50, 35, 45])

fig = pygmt.Figure()

# Define a colormap to be used for topography
pygmt.makecpt(cmap="terra", series=[-7000, 7000])

# Define figure configuration
pygmt.config(FONT_TITLE="10p,5", MAP_TITLE_OFFSET="1p", MAP_FRAME_TYPE="plain")

# Setup subplot panels with three rows and four columns
with fig.subplot(
    nrows=3,
    ncols=4,
    figsize=("28c", "21c"),
    sharex="b",
    sharey="l",
):
    # E.g. "0/90" illuminates light source from the North (top) and East
    # (right), and so on
    for azi in ["0/90", "0/300", "180/225"]:
        # "e" and "t" are cumulative Laplace distribution and cumulative
        # Cauchy distribution, respectively
        # "amp" (e.g. 1 or 10) controls the brightness value of the color
        for nor in ["t1", "e1", "t10", "e10"]:
            # Making an intensity DataArray using azimuth and normalize
            # parameters
            shade = pygmt.grdgradient(grid=grid, azimuth=azi, normalize=nor)
            fig.grdimage(
                grid=grid,
                shading=shade,
                projection="M?",
                frame=["a4f2", f"+tazimuth={azi}, normalize={nor}"],
                cmap=True,
                panel=True,
            )

fig.colorbar(position="JBC+w10c/0.25c+h", frame="a2000f500+lElevation (m)")

fig.show()
Total running time of the script: ( 0 minutes 10.659 seconds)