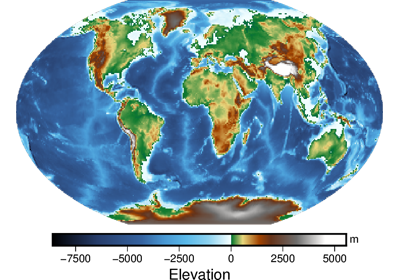
pygmt.datasets.load_earth_relief
- pygmt.datasets.load_earth_relief(resolution='01d', region=None, registration=None, data_source='igpp', use_srtm=False)[source]
Load Earth relief grids (topography and bathymetry) in various resolutions.
The grids are downloaded to a user data directory (usually
~/.gmt/server/earth/earth_relief,~/.gmt/server/earth/earth_gebco,~/.gmt/server/earth/earth_gebcosi, or~/.gmt/server/earth/earth_synbath) the first time you invoke this function. Afterwards, it will load the grid from the data directory. So you’ll need an internet connection the first time around.This module downloads the grids that can also be accessed by passing in the file name @earth_relief_type_res[_reg] to any grid plotting/processing function. earth_relief_type is the GMT name for the dataset. The available options are earth_relief, earth_gebco, earth_gebcosi, and earth_synbath. res is the grid resolution (see below), and reg is grid registration type (p for pixel registration or g for gridline registration).
Refer to https://www.generic-mapping-tools.org/remote-datasets/earth-relief.html for more details about available datasets, including version information and references.
- Parameters
resolution (str) – The grid resolution. The suffix
d,mandsstand for arc-degrees, arc-minutes, and arc-seconds. It can be"01d","30m","20m","15m","10m","06m","05m","04m","03m","02m","01m","30s","15s","03s", or"01s".region (str or list) – The subregion of the grid to load, in the form of a list [xmin, xmax, ymin, ymax] or a string xmin/xmax/ymin/ymax. Required for Earth relief grids with resolutions higher than 5 arc-minutes (i.e.,
"05m").registration (str) – Grid registration type. Either
"pixel"for pixel registration or"gridline"for gridline registration. Default is"gridline"for all resolutions except"15s"which is"pixel"only.data_source (str) –
Select the source for the Earth relief data. Available options are:
"igpp": IGPP Global Earth Relief [Default option]. See https://www.generic-mapping-tools.org/remote-datasets/earth-relief.html."synbath": IGPP Global Earth Relief dataset that uses stastical properties of young seafloor to provide a more realistic relief of young areas with small seamounts."gebco": GEBCO Global Earth Relief with only observed relief and inferred relief via altimetric gravity. See https://www.generic-mapping-tools.org/remote-datasets/earth-gebco.html."gebcosi": GEBCO Global Earth Relief that gives sub-ice (si) elevations.
use_srtm (bool) – By default, the land-only SRTM tiles from NASA are used to generate the
"03s"and"01s"grids, and the missing ocean values are filled by up-sampling the SRTM15 tiles which have a resolution of 15 arc-seconds (i.e.,"15s"). If True, will only load the original land-only SRTM tiles. Only works whendata_source="igpp".
- Returns
grid (
xarray.DataArray) – The Earth relief grid. Coordinates are latitude and longitude in degrees. Relief is in meters.
Note
The registration and coordinate system type of the returned
xarray.DataArraygrid can be accessed via the GMT accessors (i.e.,grid.gmt.registrationandgrid.gmt.gtyperespectively). However, these properties may be lost after specific grid operations (such as slicing) and will need to be manually set before passing the grid to any PyGMT data processing or plotting functions. Refer topygmt.GMTDataArrayAccessorfor detailed explanations and workarounds.Examples
>>> from pygmt.datasets import load_earth_relief
>>> # load the default grid (gridline-registered 1 arc-degree grid)
>>> grid = load_earth_relief()
>>> # load the 30 arc-minutes grid with "gridline" registration
>>> grid = load_earth_relief(resolution="30m", registration="gridline")
>>> # load high-resolution (5 arc-minutes) grid for a specific region
>>> grid = load_earth_relief(
...     resolution="05m",
...     region=[120, 160, 30, 60],
...     registration="gridline",
... )
>>> # load the original 3 arc-seconds land-only SRTM tiles from NASA
>>> grid = load_earth_relief(
...     resolution="03s",
...     region=[135, 136, 35, 36],
...     registration="gridline",
...     use_srtm=True,
... )
Examples using pygmt.datasets.load_earth_relief
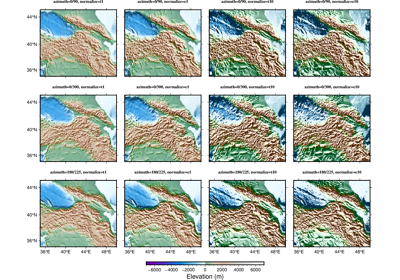
Calculating grid gradient with custom azimuth and normalize parameters