pygmt.grdclip
- pygmt.grdclip(grid, outgrid=None, above=None, below=None, between=None, replace=None, region=None, verbose=False, **kwargs)[source]
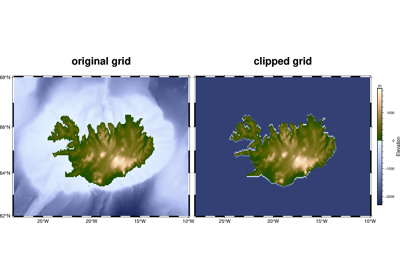
Clip the range of grid values.
This function operates on the values of a grid. It can:
Set values smaller than a threshold to a new value
Set values larger than a threshold to a new value
Set values within a range to a new value
Replace individual values with a new value
Such operations are useful when you want all of a continent or an ocean to fall into one color or gray shade in image processing, when clipping the range of data values is required, or for reclassification of data values. The values can be any number or NaN (Not a Number).
Full GMT docs at https://docs.generic-mapping-tools.org/6.6/grdclip.html.
Aliases:
G = outgrid
R = region
Sa = above
Sb = below
Si = between
Sr = replace
V = verbose
- Parameters:
grid (
str|PathLike|DataArray) –Name of the input grid file or the grid loaded as a
xarray.DataArrayobject.For reading a specific grid file format or applying basic data operations, see https://docs.generic-mapping-tools.org/6.6/gmt.html#grd-inout-full for the available modifiers.
outgrid (
str|PathLike|None, default:None) – Name of the output netCDF grid file. If not specified, will return anxarray.DataArrayobject. For writing a specific grid file format or applying basic data operations to the output grid, see https://docs.generic-mapping-tools.org/6.6/gmt.html#grd-inout-full for the available modifiers.above (
Sequence[float] |None, default:None) – Pass a sequence of two values in the form of (high, above), to set all node values greater than high to above.below (
Sequence[float] |None, default:None) – Pass a sequence of two values in the form of (low, below) to set all node values less than low to below.between (
Sequence[float] |Sequence[Sequence[float]] |None, default:None) – Pass a sequence of three values in the form of (low, high, between) to set all node values between low and high to between. It can also accept a sequence of sequences (e.g., list of lists or 2-D numpy array) to set different values for different ranges.replace (
Sequence[float] |Sequence[Sequence[float]] |None, default:None) – Pass a sequence of two values in the form of (old, new) to replace all node values equal to old with new. It can also accept a sequence of sequences (e.g., list of lists or 2-D numpy array) to replace different old values with different new values. This is mostly useful when your data are known to be integer values.region (
Sequence[float|str] |str|None, default:None) – [xmin, xmax, ymin, ymax] or xmin/xmax/ymin/ymax[+r][+uunit]. Specify the region of interest.verbose (
Literal['quiet','error','warning','timing','info','compat','debug'] |bool, default:False) – Select verbosity level [Full usage].
- Return type:
- Returns:
ret – Return type depends on whether the
outgridparameter is set:xarray.DataArrayifoutgridis not setNoneifoutgridis set (grid output will be stored in the file set byoutgrid)
Example
>>> import pygmt
>>> # Load the 30 arc-minutes Earth relief grid, with a longitude range of 10° E to
>>> # 30° E, and a latitude range of 15° N to 25° N
>>> grid = pygmt.datasets.load_earth_relief(
...     resolution="30m", region=[10, 30, 15, 25]
... )
>>> # Report the minimum and maximum data values
>>> [grid.data.min(), grid.data.max()]
[np.float32(183.5), np.float32(1807.0)]
>>> # Create a new grid from an input grid. Set all values below 1,000 to 0 and all
>>> # values above 1,500 to 10,000
>>> new_grid = pygmt.grdclip(grid=grid, below=[1000, 0], above=[1500, 10000])
>>> # Report the minimum and maximum data values
>>> [new_grid.data.min(), new_grid.data.max()]
[np.float32(0.0), np.float32(10000.0)]