Gallery
This gallery contains examples of what PyGMT can do. Click on any example to see the code used to generate it.
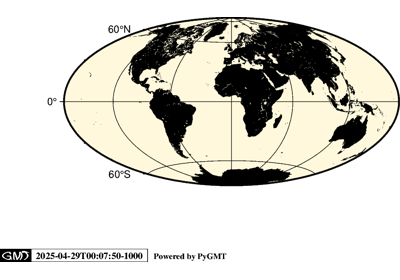
Maps and map elements

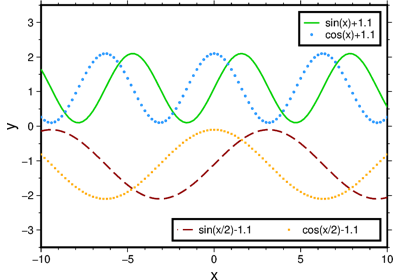
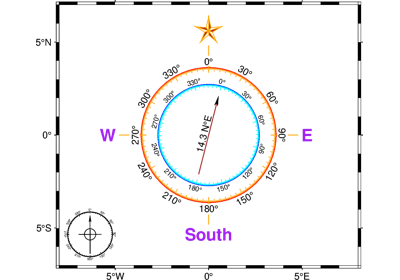
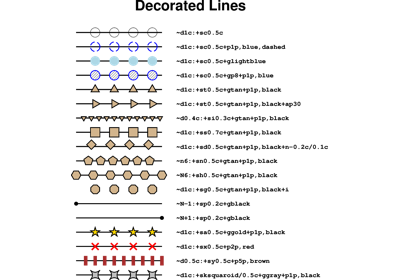
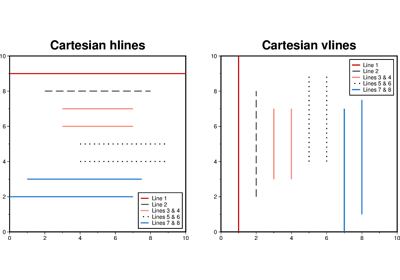
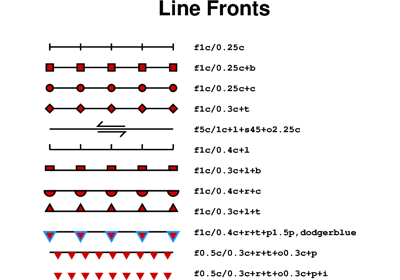
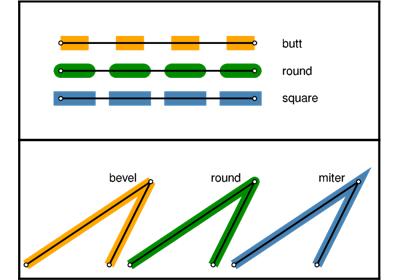
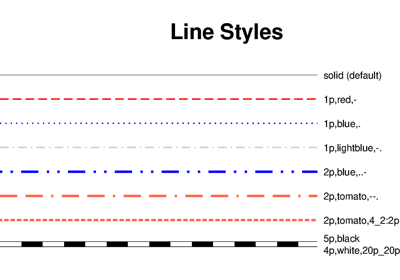
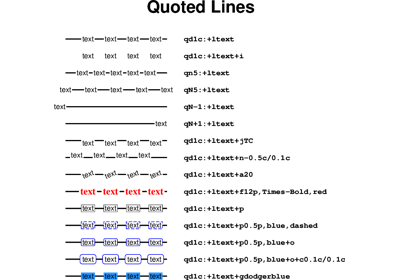
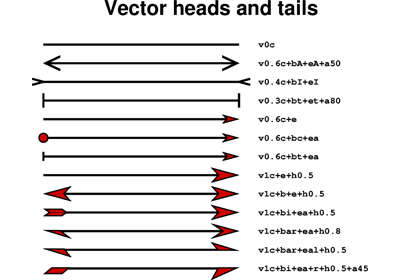
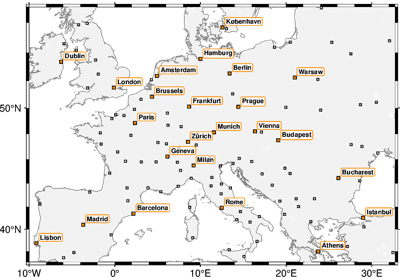
Lines and vectors
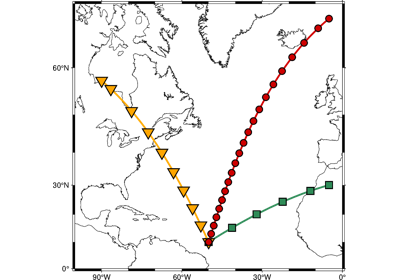
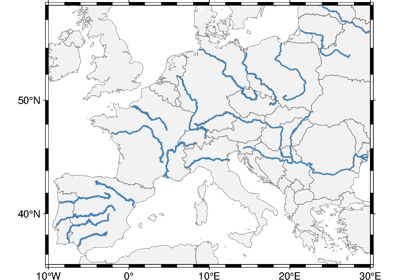
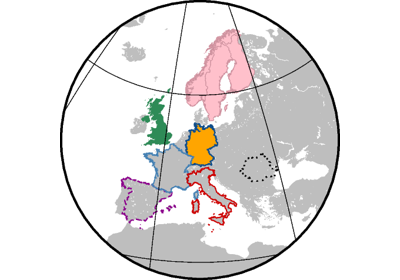
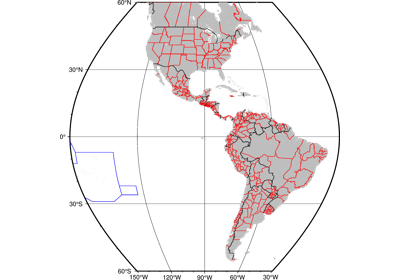
GeoPandas: Plotting lines with LineString or MultiLineString geometry
GeoPandas: Plotting lines with LineString or MultiLineString geometry
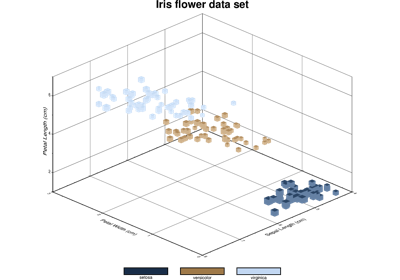
Symbols and markers

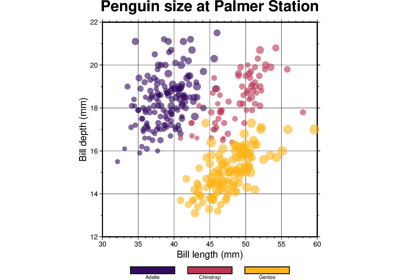


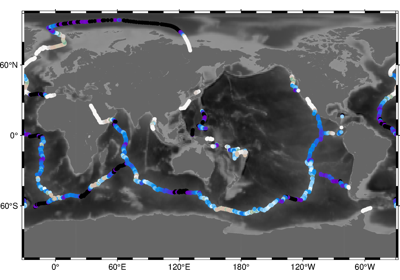
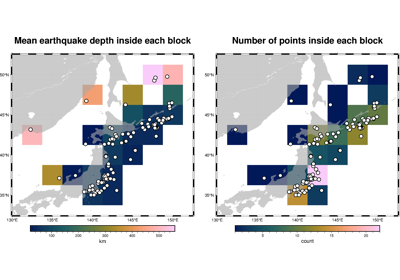
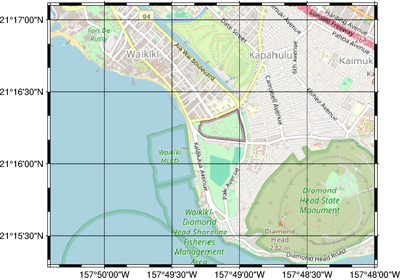
GeoPandas: Plotting points with Point or MultiPoint geometry
GeoPandas: Plotting points with Point or MultiPoint geometry

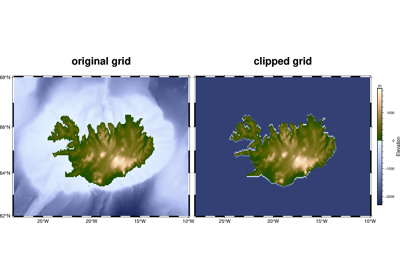
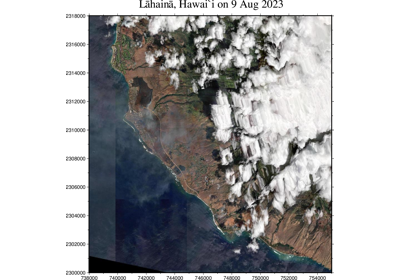
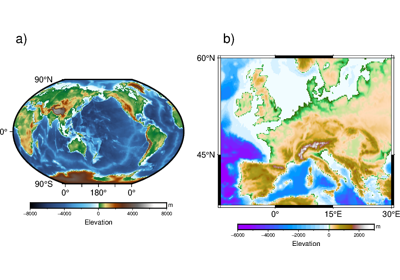
Images, contours, and fields
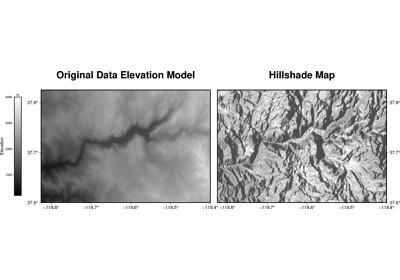
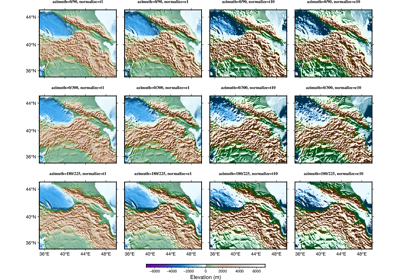
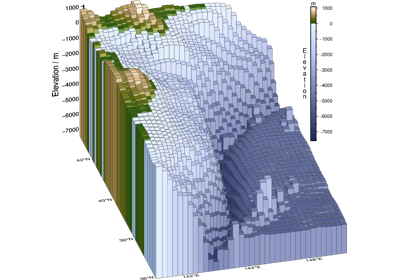
Calculating grid gradient with custom azimuth and normalization parameters
Calculating grid gradient with custom azimuth and normalization parameters